
Performance improvements
Several improvements have been made in the performance in this version. The SoftExpert Analytics card has been rewritten with the objective of returning the data faster. When compared to the previous version, the time to display a chart has become, on average, 60% faster.
New Single table component
The single table component has been replaced. Now, scrolling is much more precise and the column width does not change when scrolling, which was a large distraction in the previous version.
Increase in the Pivot Table limit
We have increased the limit of cells supported by the Pivot table from 15 thousand to 30 thousand, allowing you to view more data.
This improvement is not applicable to Internet Explorer. |
Visual improvements to charts
In this version, all graphic components have been switched and a new visual theme has been applied. The colors have become more vibrant and pleasant.
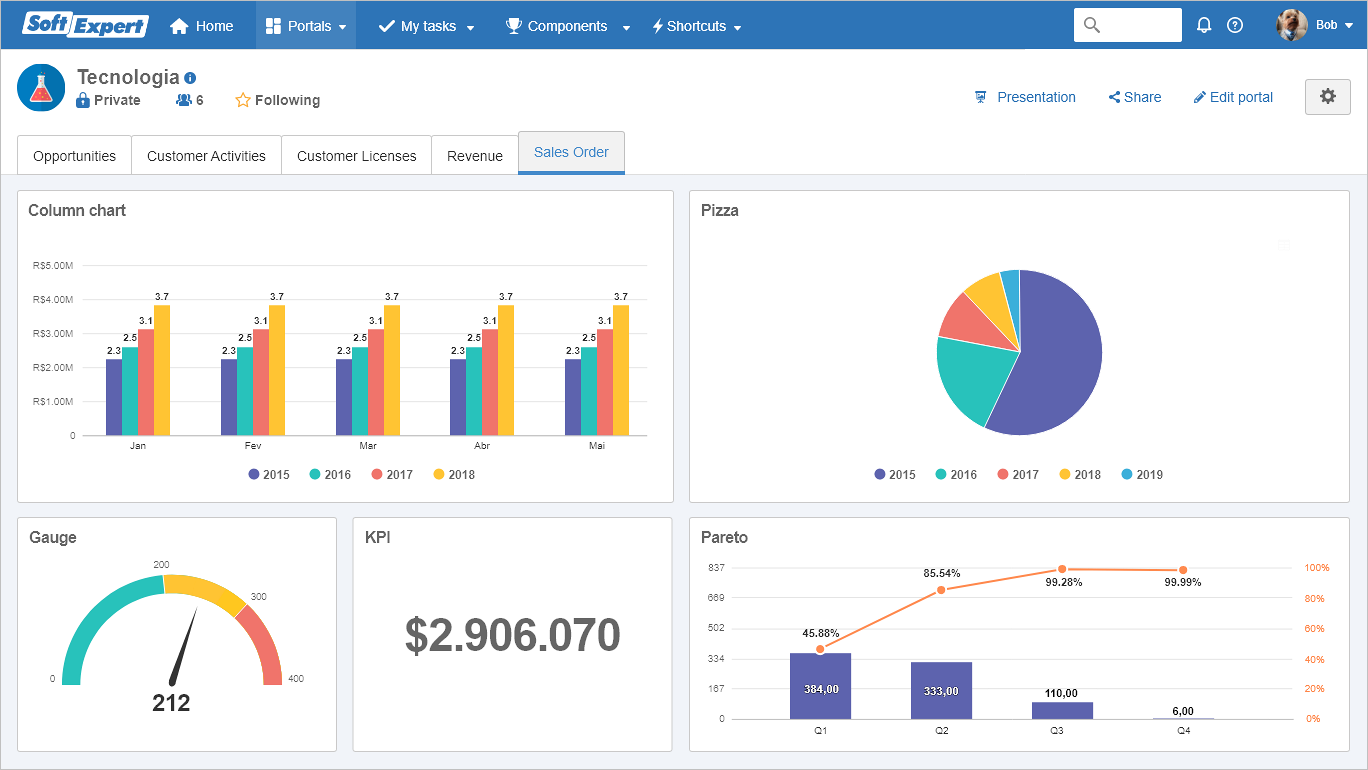
The charts are now responsive, that is, the elements of the chart are automatically adjusted according to the size of the screen you are using.
Important: ▪The 3D option has been removed from charts in this version. Typically, 3D charts are hard to read, since the perspective makes some parts of the chart seem bigger than what they really are, especially in pie and bar charts. In addition to that, when the bar chart has reference lines, it can be extremely difficult to precisely identify if certain bar is within or outside the reference line. ▪In this version, the colors (Contrast, Light, Warm, Cool) are no longer applied to the charts, and only the colors available in the default theme are being applied. In future versions, it will be possible to define specific colors for your charts. |
Filter bar in the portal
For you to always be able to easily track and control which filters are applied to the SoftExpert Analytics visions, the portal now displays a filter bar whenever you apply a drilldown or click on the magnifying glass of the SoftExpert Analytics card. Thus, the filter bar will always display the filters that are applied at that moment, allowing you to easily track, edit or delete them whenever necessary.
Filters saved in the portal
Aiming at giving you agility on daily tasks and avoiding the need to manually filter the portal every time it is loaded, it is now possible to keep the filters saved in the portal tab, thus making the system always load the previously filtered SoftExpert Analytics visions.
To save a filter, simply click on Edit portal and Add filters. After setting the desired filter, simply click on Save changes. When closing the editing mode, the portal will be reloaded with the applied filters.
Vision creation through the portal
Now it is possible to create visions directly in the portal, without the need to go to the Analytics  File Analysis panel (AN003) menu. To create a new vision, simply click on the Create vision button and select the analysis in which the vision will be created. Once the vision is created, you can drag it to the desired position in the portal.
Copying a vision through the portal
Aiming at making the portal assembly faster, it is now possible to copy a vision and immediately edit it.
Graphic viewing of large volumes of data
Aiming at allowing the viewing of large volumes of data, the charts no longer have the limit of 150 points that existed up to version 2.0 and are now displayed normally.
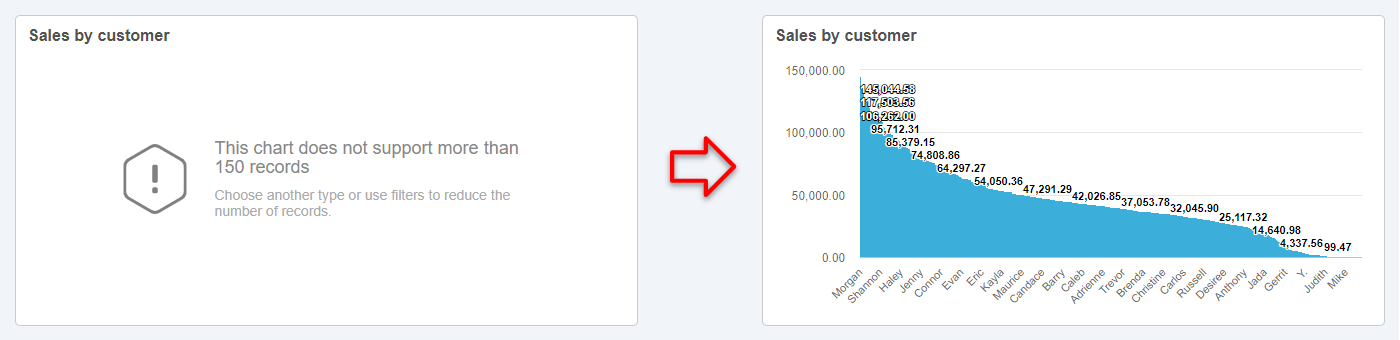
By default, the charts now display a macro vision of data, but, whenever necessary, the system allows you to zoom in, that is, to select the part of the chart you wish to view in detail. When selecting the desired part, the system will enlarge it; to zoom out, simply click on the Restore zoom button.
Shortcut for analysis editing
Aiming at making the assembly of the portal faster, the system now displays, next to the card information, a button to open the analysis editing screen; thus, you can edit the analysis without the need to go to the Analytics File Analysis panel (AN003) menu.
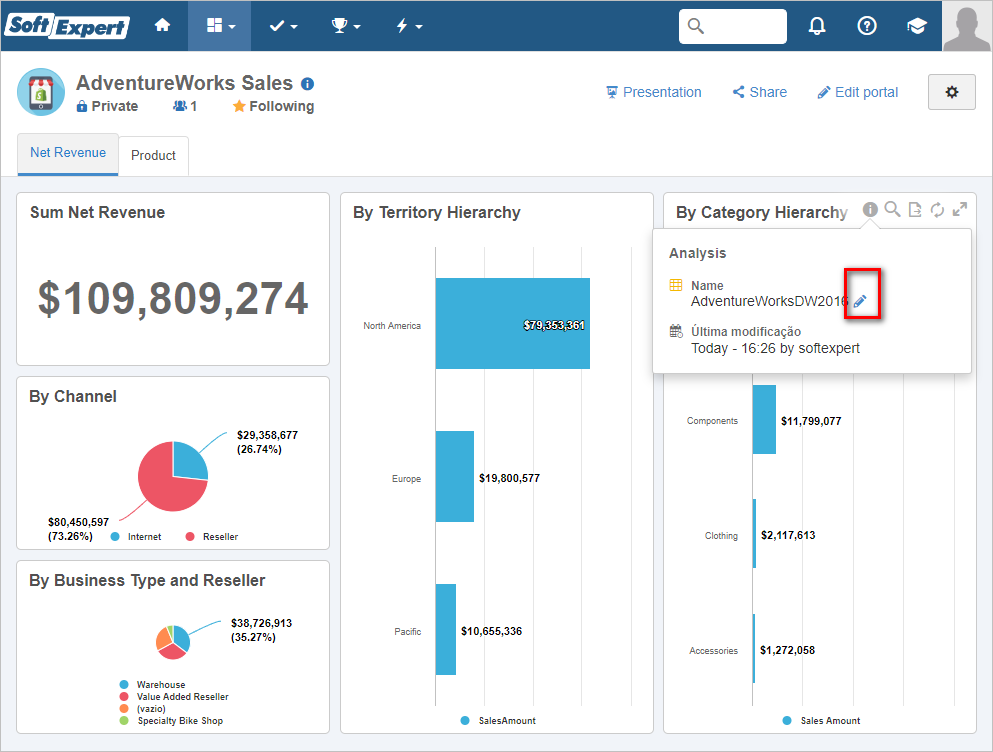
This feature will only be available to users with permission in the analysis and who have access to the Analytics |

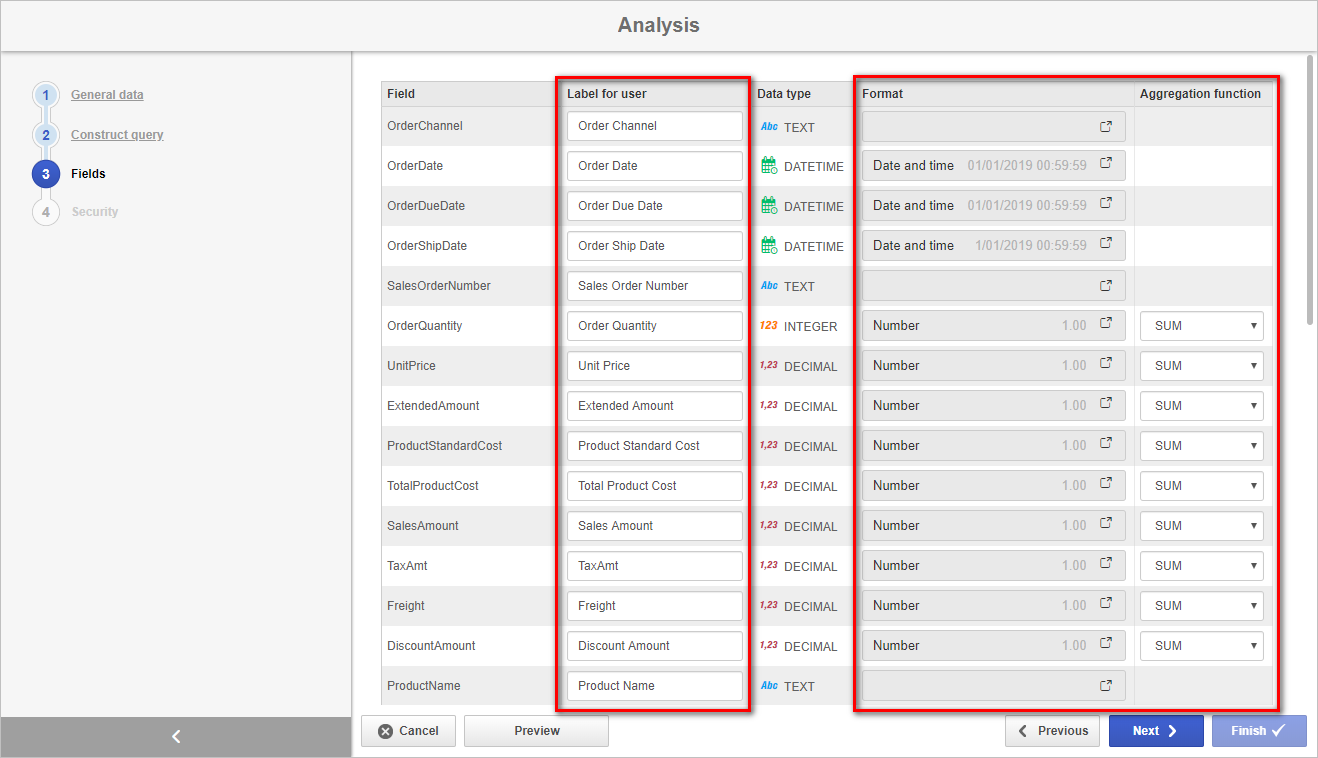
Improvement in analysis creation
Now, when editing the SQL SELECT instruction of the analysis, the system can recover and maintain the properties of the fields (Label for user, Format and Aggregation function) that had already been set; thus, you will no longer need to reset them every time the SQL instruction is edited.
Alert on slow analyses
The system now alerts the users whenever slow analyses are identified, that is, analyses that extrapolated the Timeout configuration for the execution of the SQL command and make the database server processing last longer than desired.
This alert is important because the users responsible for the system can take some action, such as requesting the SQL revision and/or activating the analysis materialization. It is important to note that only the users that have editing permission in the analysis and access to the Analytics File Analysis panel (AN003) menu will be alerted.
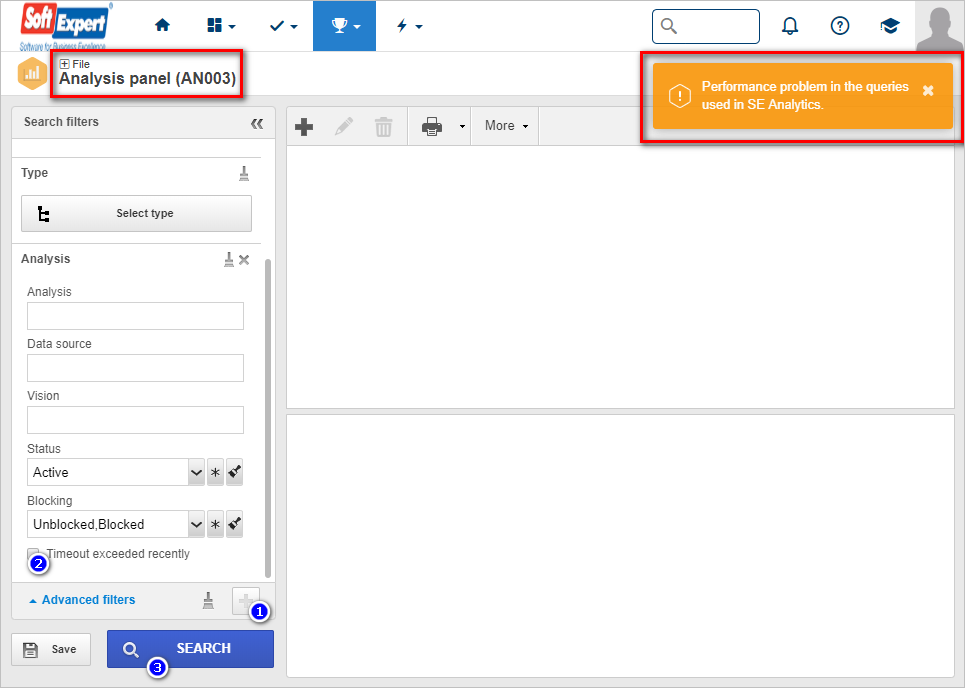
One way of knowing which analysis triggered the timeout is:
1.going to the Analytics File Analysis panel (AN003) menu
2.checking the filter Timeout exceeded recently
3.and clicking on Search for the system to list the slow analyses.
Note: Analyses that have had a timeout in the past 3 hours are considered slow. |
Previous versions
View also the improvements made to this component in previous versions:
