|
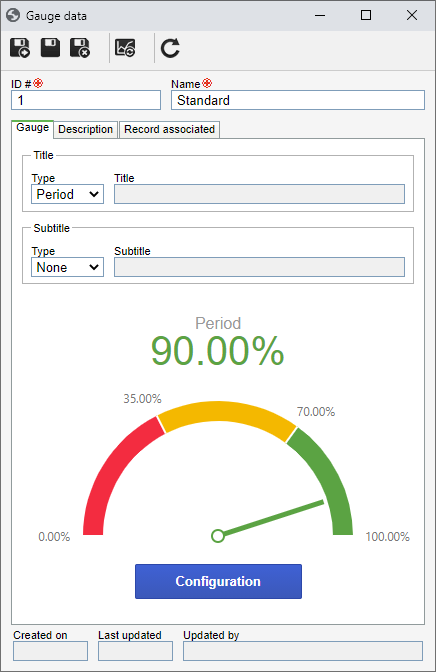
To add a new gauge, click on the  button on the main screen toolbar. To edit the data of a gauge, select it in the list of records and click on the button on the main screen toolbar. To edit the data of a gauge, select it in the list of records and click on the  button. button.
On the screen that will be opened, enter an ID # and a name for the gauge.

Save the record. At this point, the following tabs will be available to be configured:
First, configure how the information will be displayed in the Title and Subtitle of the gauge. In the corresponding fields, select one of the following options:
Type
|
|
Other
|
The system will display the information entered by the user. In the Title/Subtitle field, enter the information that must be displayed.
|
Name
|
The system will display the name of the indicator the gauge is related to.
|
Period
|
The system will display the period configured for the indicator the gauge is related to.
|
None
|
The gauge will not have information in the title/subtitle.
|
Use the Configuration option to customize the presentation of the gauge chart. On the screen that will be opened, several buttons are available to manipulate the chart characteristics, divided in the following sections:
Record
|
Save
|
Click on this button to save the performed configurations.
|
Save and exit
|
Click on this button to save the performed configurations and close the screen.
|
Charts
|
Chart
|
Click on the arrow located below this option and select the desired appearance for the gauge chart presentation: 90º gauge, 180º gauge, 200º gauge, Linear horizontal or Linear vertical.
|
Display
|
Label
|
Click on the arrow located below this option to set how the chart labels are displayed: at the beginning and end of the chart or at the beginning and end of each range of values.
|
Pointer
|
Click on the arrow located below this option to set how the gauge graph meter will be displayed: default (needle pointer) or bar.
|
Value
|
Click on the arrow located below this option to set how the gauge chart values are displayed: in the center or next to the pointer.
|
Use the  button on the gauge data screen toolbar to restore the characteristics of the gauge chart to default. button on the gauge data screen toolbar to restore the characteristics of the gauge chart to default.
|
|
Use this tab to specify the gauge being configured.
|
This tab will only be enabled when the gauge is associated with a range or a portal. In it, it will be listed the ranges and portals in which the gauge is being used. The gauges that have association can be identified by the "A" (Associated?) column, in the records list on the main screen.
|
After setting all the necessary configurations, save the record.
|


