|
This section will display how to work with SE Analytics visions in SE Suite portals:
▪To avoid problems with viewing visions in the portals, make sure to add the SE Suite URL to the list of plugin exceptions (e.g.: 3CX Click to call) and ad blockers (e.g.: AdBlock). ▪It is not recommended to use more than ten visions/widgets in a portal, as it may cause slowness. |
▪If the portal is shared with a group of people, make sure the vision can be viewed by them. If necessary, access the "File  Analysis panel" menu and edit the analysis/vision security. Analysis panel" menu and edit the analysis/vision security. ▪When using visions of a same analysis in the same panel (tab) of the portal, the widgets will be related, that is, when clicking on a value from a vision widget, the information of the other widgets will be drilled down according to the selected value. |
The analysis and visions created in the system can be used as a widget in a portal. To do that, access the portal menu and locate the desired portal. If the portal does not exist, create it and access edit mode. To access the edit mode of a portal, simply click on the "Edit" option displayed when clicking on the  button of the card in the portal list, or click on the "Edit portal" option displayed in the upper right corner on the portal screen. button of the card in the portal list, or click on the "Edit portal" option displayed in the upper right corner on the portal screen.
On portal edit mode, click on the "Add element" button to display the panel that has the widgets by component. Click on the "Analytics" component:
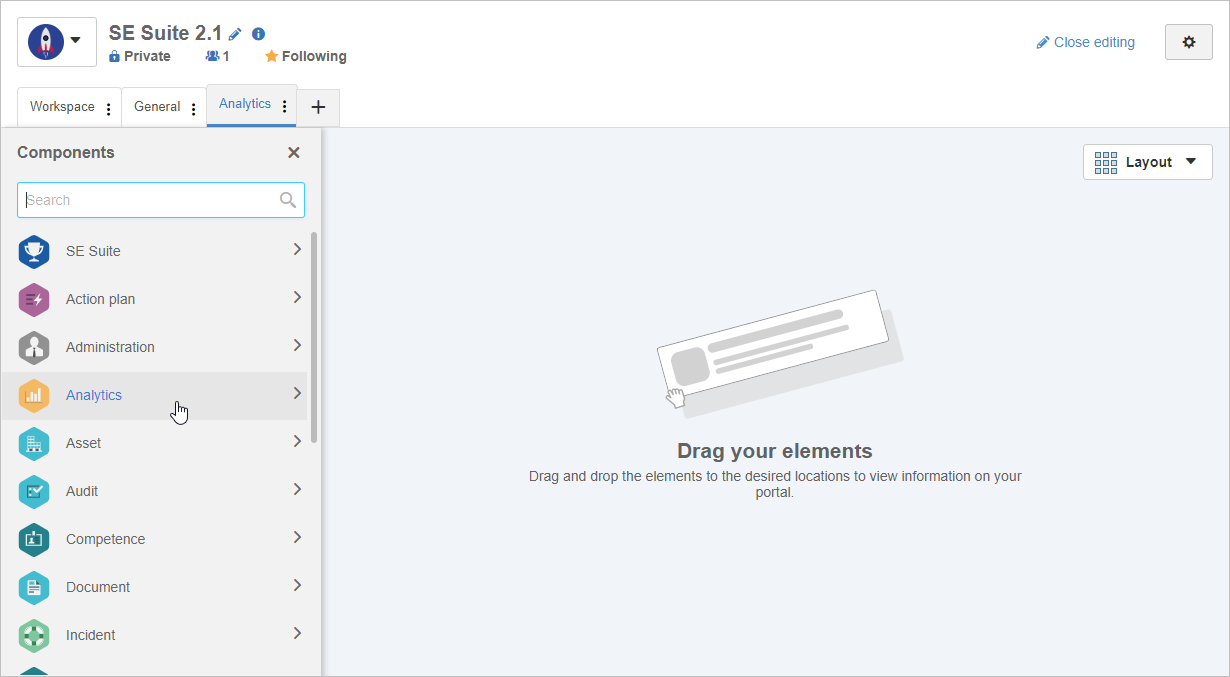
The panel will display all available visions that you have permission to view and/or edit. However, it is possible to create a vision by clicking on the "Create vision" available next to the search field on the panel.
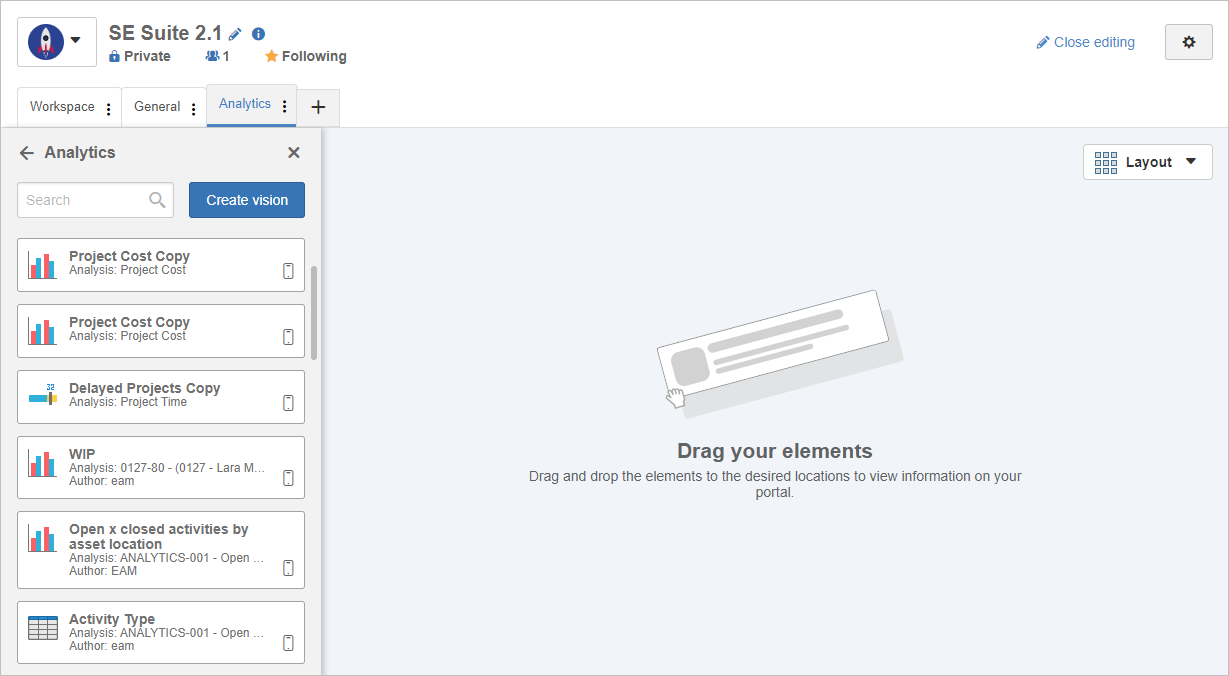
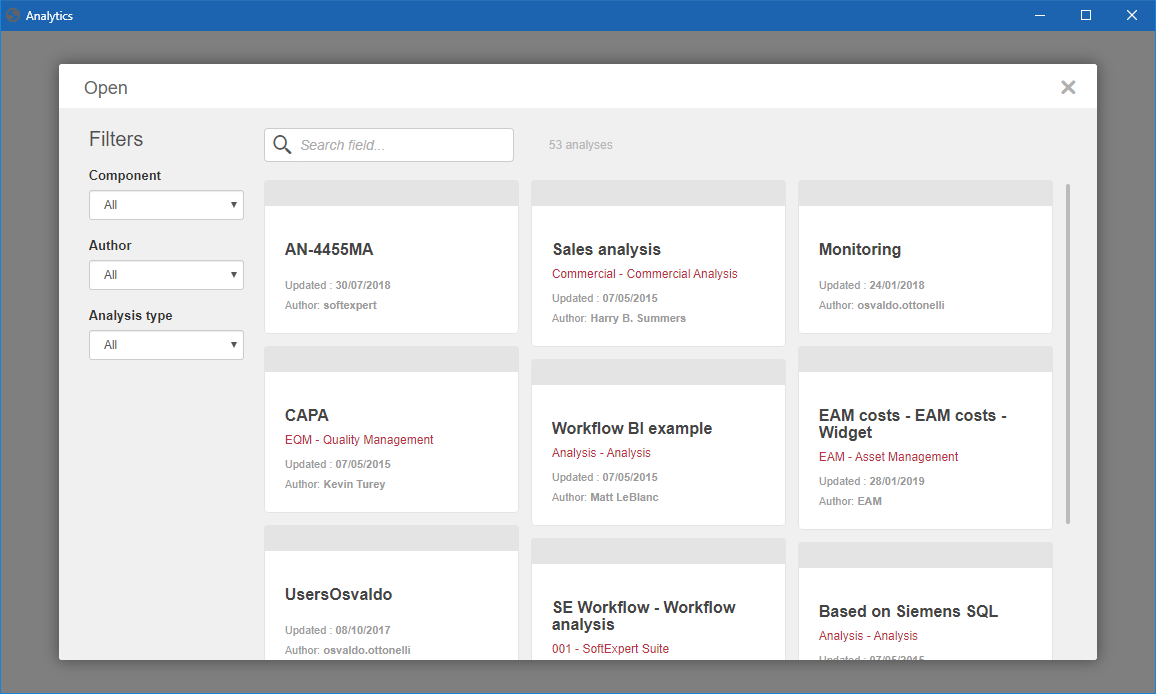
By clicking on the "Create vision" button, a screen will be displayed with the analyses available to create the vision. Select the desired analysis and create the vision according to the description in the . After saving and closing the vision, return to portal editing.
Locate the desired vision and drag it to the portal area. If necessary, resize the widget to the desired size.
If two or more visions from the same analysis are added, the resource to filter between visions can be used in the portal, that is, when clicking on information in one of the visions, a filter will be added to the portal, causing the other visions to be reloaded according to the filtered information.
|
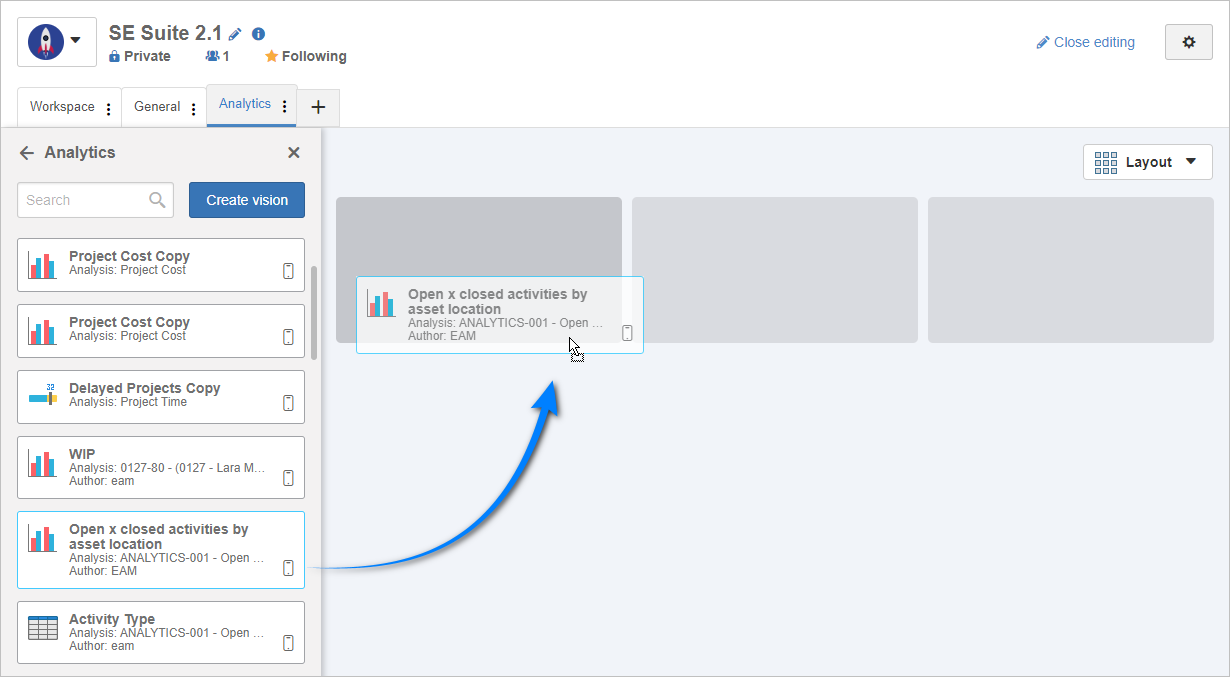
After adding the vision to the portal, save it and close editing.
|
If the added vision comes from a view menu, it is possible to add a link to open the view object data screen. To configure it, simply edit the portal and, in the vision widget, click on the  (Edit) button: (Edit) button:

At this point, the vision screen will be opened in edit mode.
The example below displays a vision created in SE Document. In it, a link will be added to access the data of the document displayed in the vision, according to its ID #. To do that, the following steps are performed:
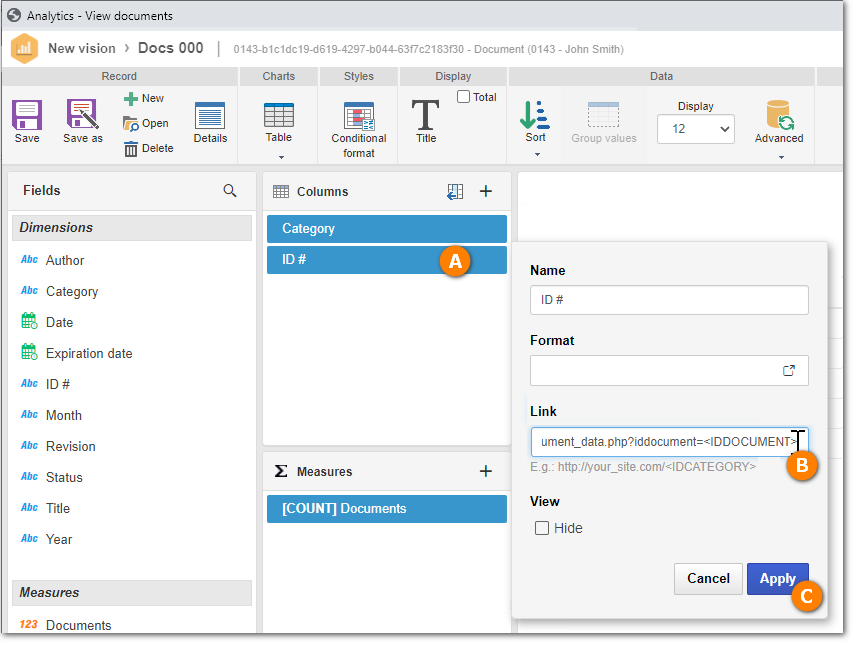
Click on the object to which the link will be added (A). On the screen that will be displayed on the side, enter the link to open the data of the respective parameter (B). Note that the object parameter is already displayed as a suggestion at the bottom of the field. Then, click on "Apply" (C). Next, click on the "Update" option. Save the changes made to the vision.
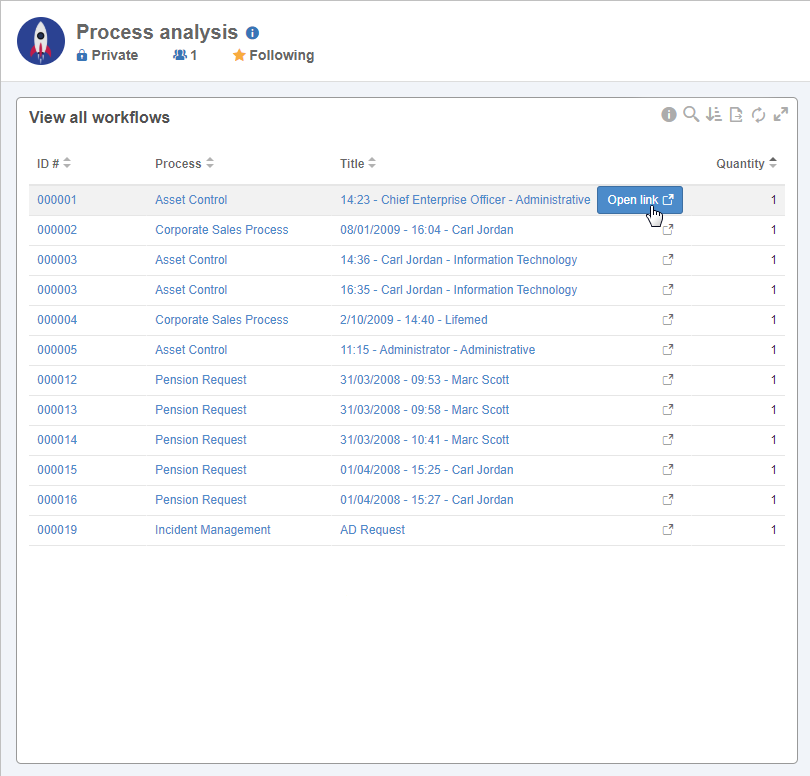
After saving the configuration, return to the portal. Note that the access link will be identified by the  icon and, after clicking on it, the object data screen will be opened in a new window. icon and, after clicking on it, the object data screen will be opened in a new window.
|
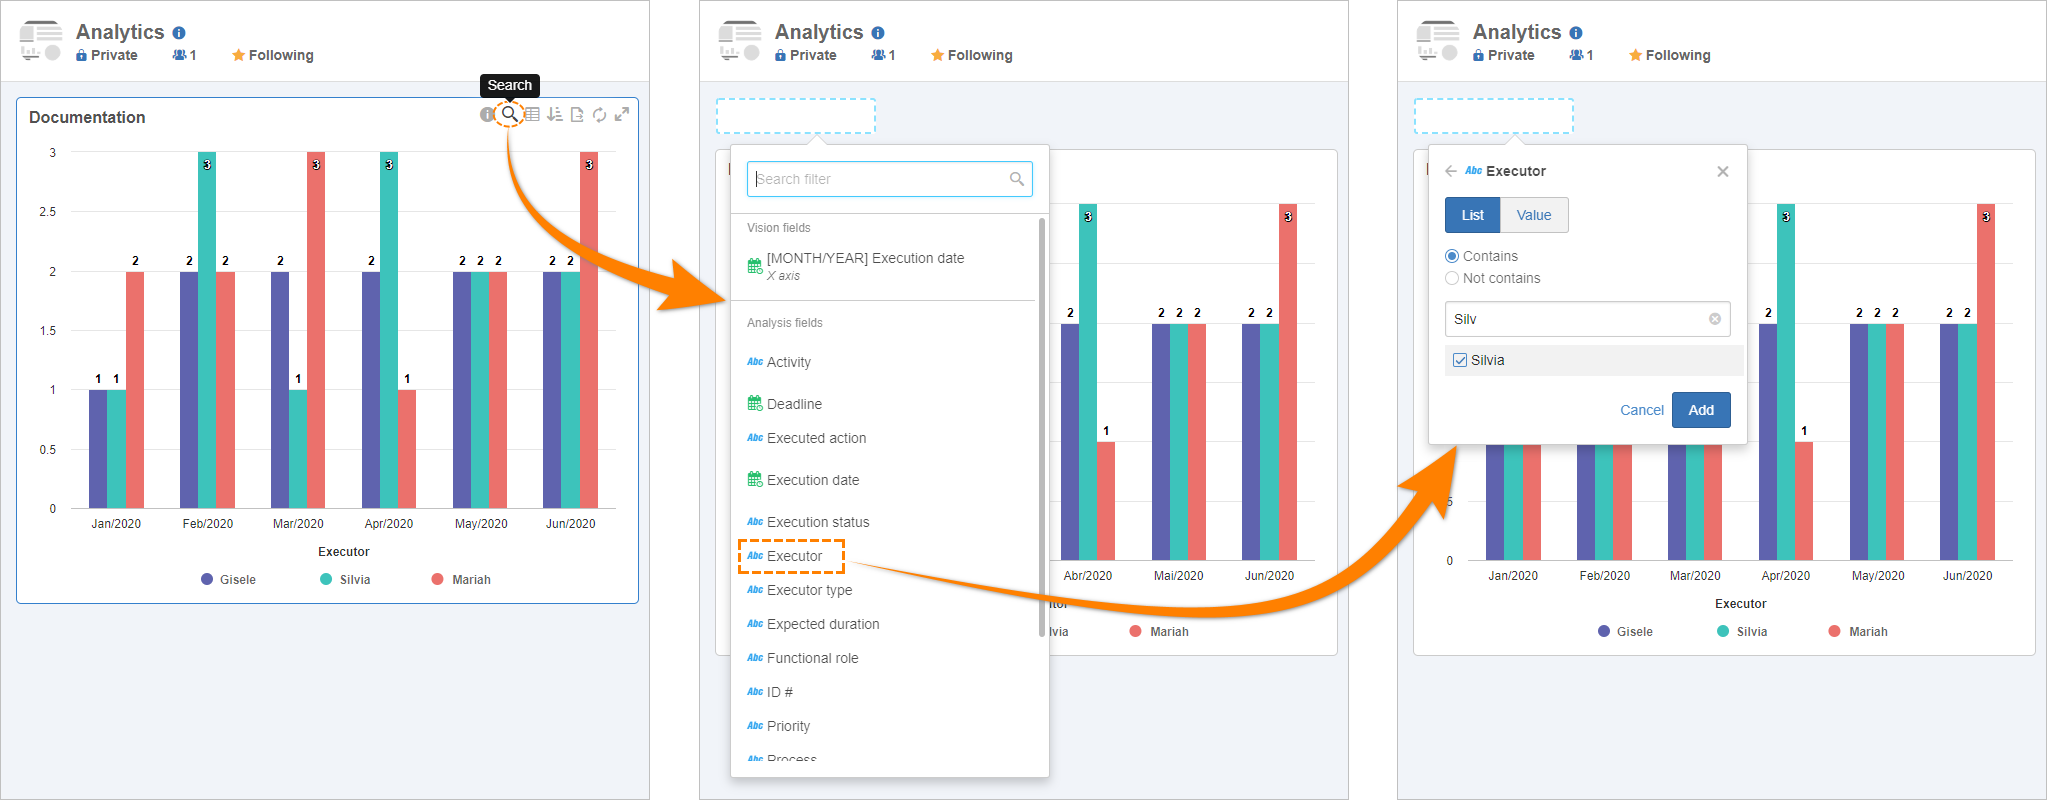
The vision widgets allow filtering the values of certain analysis fields. To filter information, click on the  button, select the analysis field and enter the value to be filtered. button, select the analysis field and enter the value to be filtered.
Vision filters can also be applied to portals when editing them, causing the filters to be loaded when accessing the portal. To do that, access portal edit mode and click on the "Add filters" button. This button is only displayed when there are SE Analytics vision widgets.
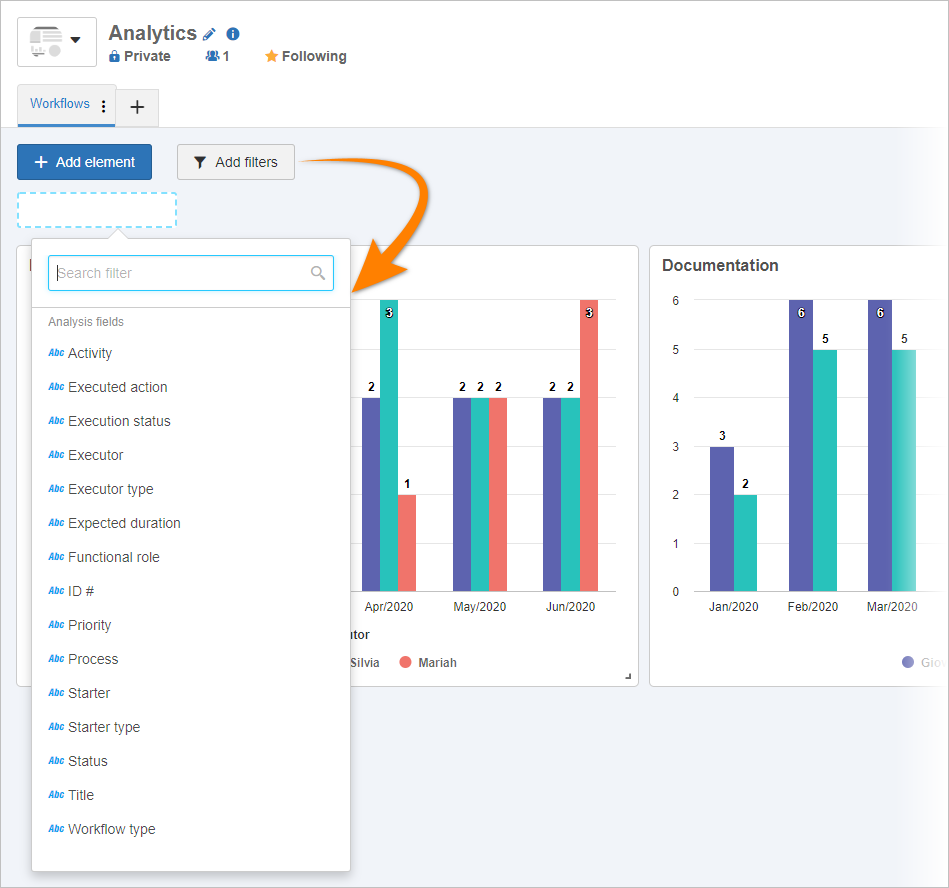
At this point, the list of the analysis fields that may be used as filters will be displayed. Select the desired field and define the value it must have for the information to be displayed in the visions.
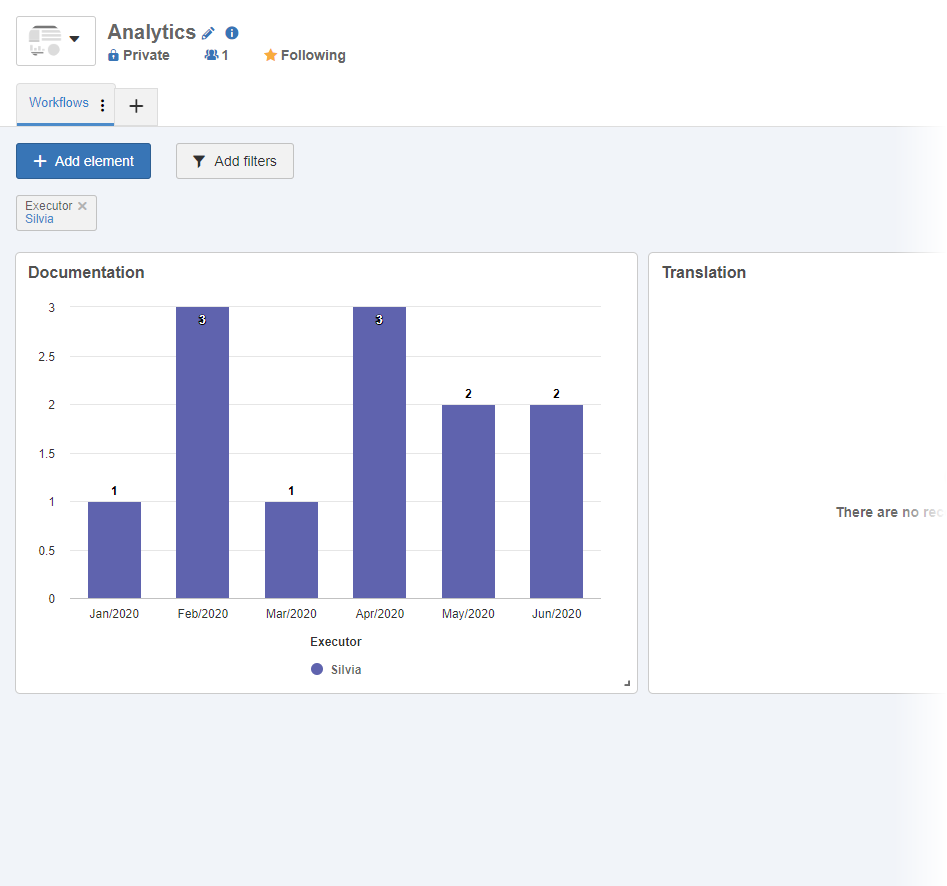
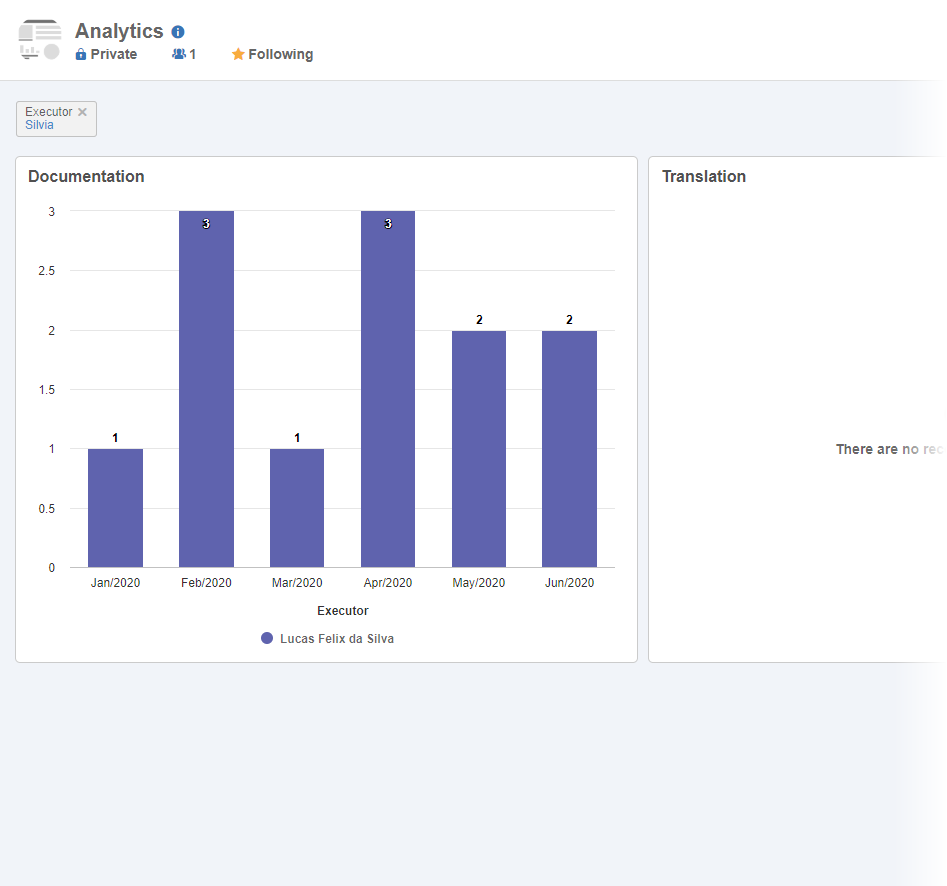
At this point, the visions will be updated according to the applied filter. Now, simply save the portal; once it is accessed, the filter will already be applied. If the user wishes to view all information, the filter can be removed in portal search.
|
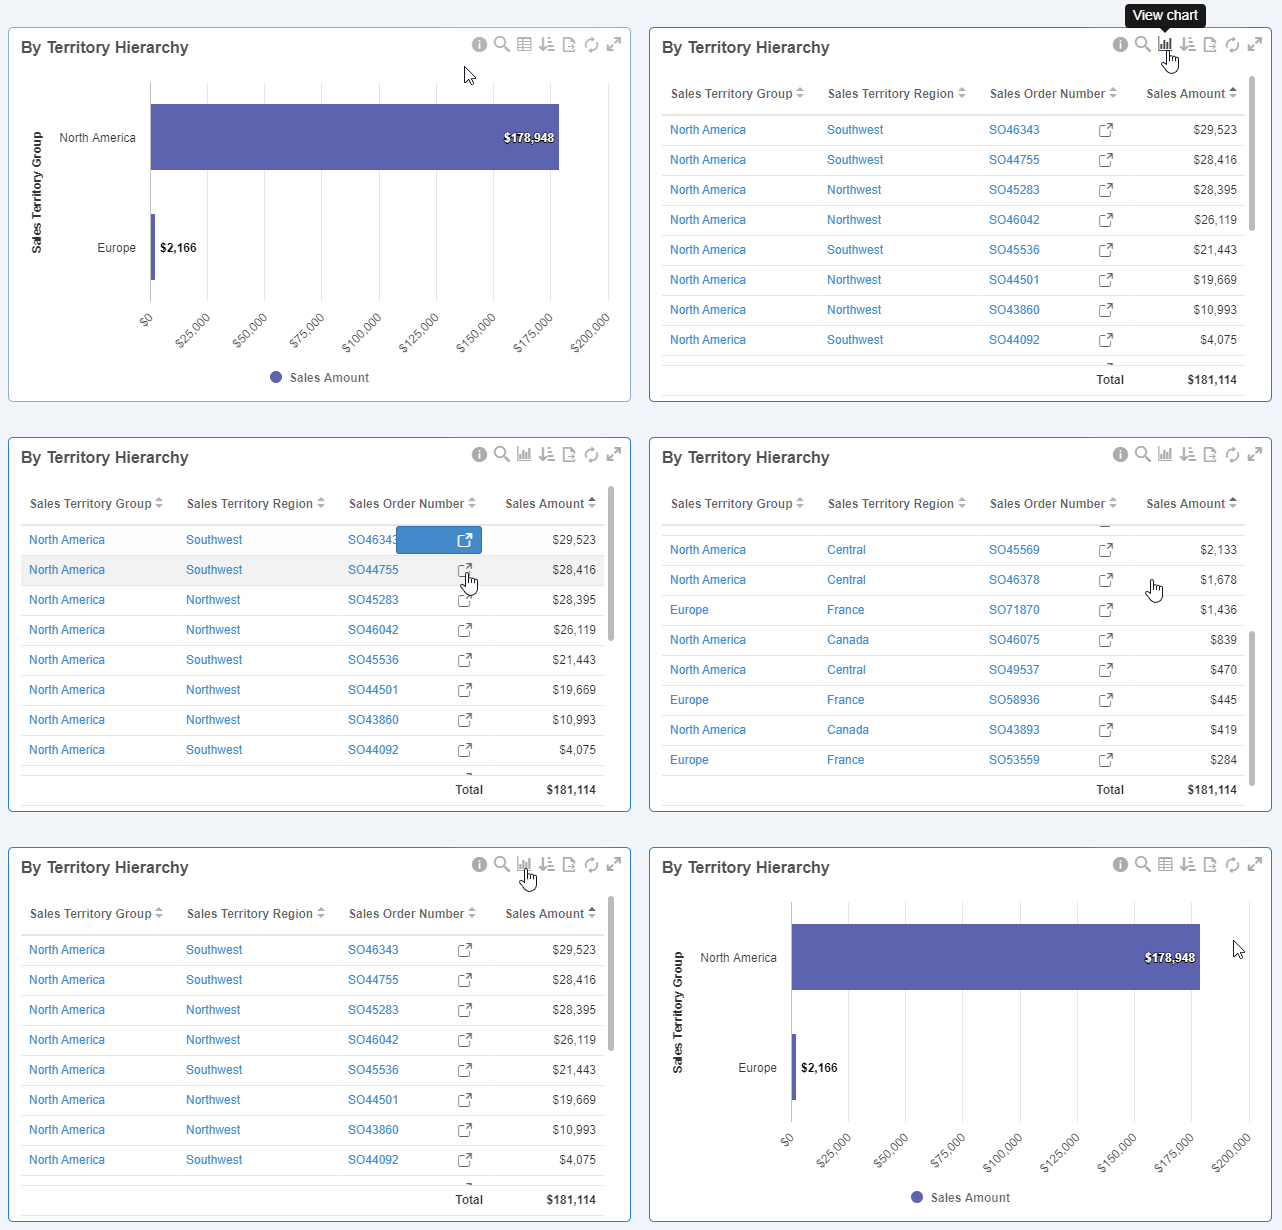
When viewing a portal, it is possible to view all records that originated the vision chart, as well as to allow the user, if authorized, to access the data screens of these records. By clicking on the  (View data) button, the system will display a table, allowing the user to export the data through operations such as filtering, drilling down, exporting, and others. By clicking on (View data) button, the system will display a table, allowing the user to export the data through operations such as filtering, drilling down, exporting, and others. By clicking on  (View chart), the system displays the chart again. (View chart), the system displays the chart again.
|
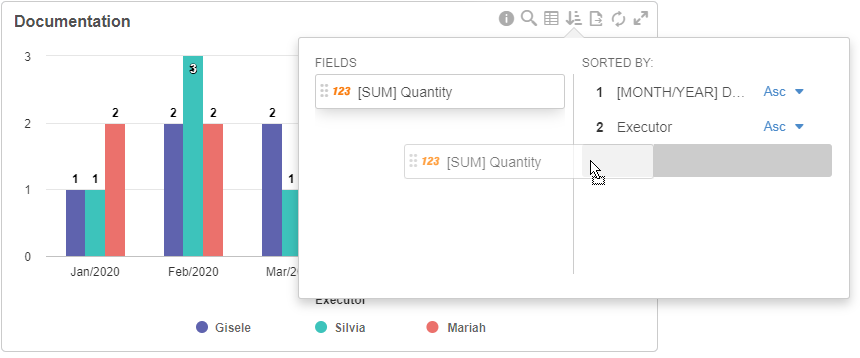
Through the  (Sort) button in the vision card, it is possible to change the data sorting criteria. Thus, it is not necessary to open OLAP to sort the data. By clicking on this button, a screen will be displayed in which it will be possible to define the fields that will be used for the sorting. (Sort) button in the vision card, it is possible to change the data sorting criteria. Thus, it is not necessary to open OLAP to sort the data. By clicking on this button, a screen will be displayed in which it will be possible to define the fields that will be used for the sorting.
|
|


