Objective measurement |
|
|
The collection of objective measurements is performed through the following data screen. See the collection steps below:
1.
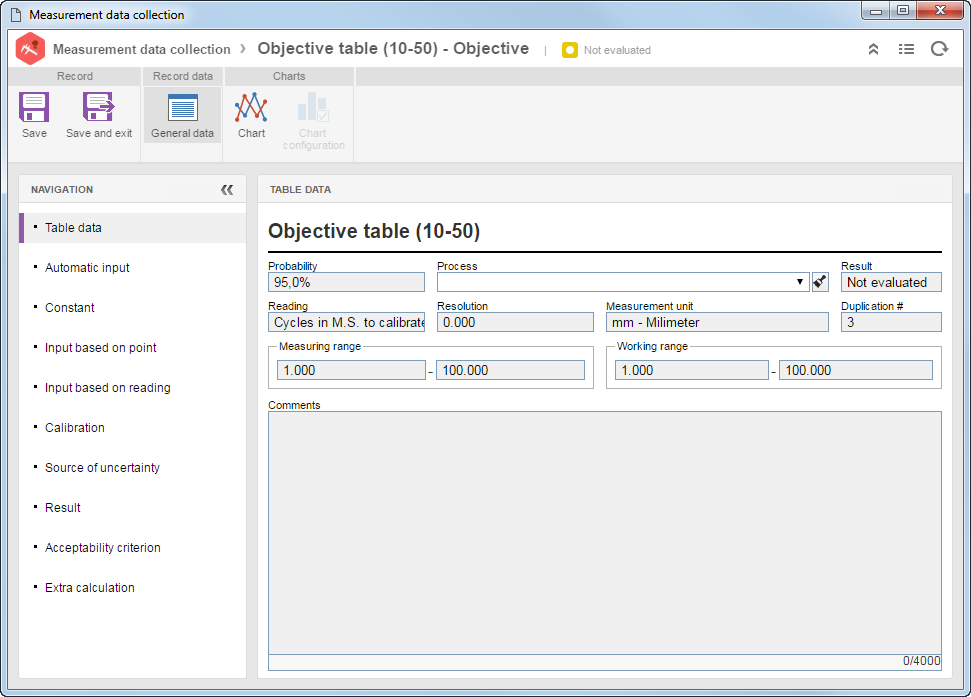
2.In the Table data section, the system will display the general data of the table in which the measurement is being performed. The fields displayed in this section vary according to the configuration set in the General tab of the calibration table: Probability: This field will display the probability configured for this measurement table. This probability is the interval around the measurement result, which is expected to encompass a large fraction of the distribution of values that could reasonably be assigned to the magnitude subject to measurement. Process: Select the process that will be used in the asset calibration. The system will make available the processes that were associated in the Process tab of the calibration table. Result: This field will only be displayed if the Control calibration result option is selected in the standard activity of the calibration in question. After entering the measurements and saving the record, then the system automatically displays the result obtained in the measurement collection. Reading: This field will display the measurement system that was configured for the calibration table. This field will only be displayed if the calibration was configured with the variable magnitude option. Resolution: This field will display the resolution that was configured for the calibration table. The resolution is the smallest reading that may be performed in the asset; it may be a fraction of the asset indication. Measurement unit: This field displays the measurement unit used in the measurement that was configured for the calibration table. Duplication #: This field displays the number of reading cycles to be performed in the calibration of the assets of this configuration. Measuring range: This field displays the range that indicates the measurement capacity of the asset. This field will only be displayed if the calibration was configured with the variable magnitude option. Working range: This field displays the range that indicates the measurement range that is actually used in the organization. This field will only be displayed if the calibration was configured with the variable magnitude option. Nominal value: This field displays the range that indicates the measurement range that is actually used in the organization. This field will only be displayed if the calibration was configured with the invariable magnitude option. Comments: This field displays the comments entered for the calibration table in question.
3.The Automatic input section will only be displayed if, in the calibration table, it was set that the input of at least one of the variables would be automatic. In that case, the value of each variable will be calculated by the system based on a default, table, and other data. For that, click on the Standard: Select the standard for the variable. The system will make available the standards associated before in the Standard section. Table: Select the table for the variable. This field depends on the configuration of the calibration in question. Points: Select a point for the variable. Remember that this field will only be displayed on the screen if there are no constant type variables and if selecting the Retrieve point data option. These fields depend on the configuration of the calibration in question. Equation: This field displays the equation selected in the variable data. These fields depend on the configuration of the calibration in question. Value: The system calculates the value for the variable according to the entered data.
Save the record after filling in the variable data.
4.The Constant section will only be displayed if, in the calibration table configuration, it was set that the reading of at least one variable would be a constant value. In that case, use this section to enter the values for each constant variable associated with the calibration. For that, enter the value of each variable in the respective field, located in the Value column. The values may be collected in the following ways: ▪Manually: The values must be entered manually in the columns of the meter reading spreadsheet itself. ▪Copy/Paste: The values can be copied/pasted from/to an Excel spreadsheet. For that, use the following buttons:
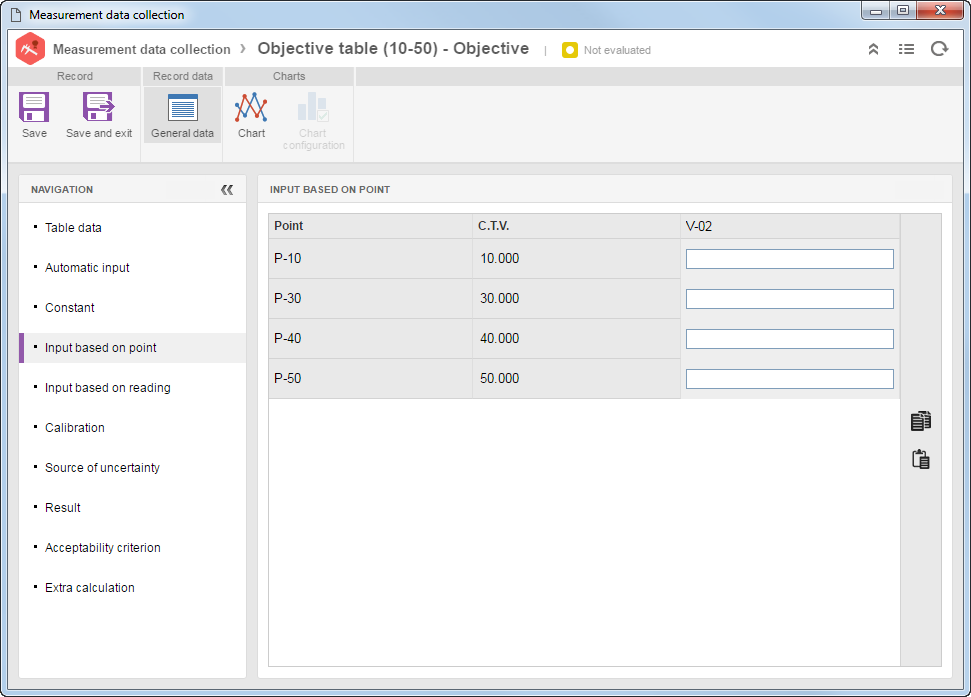
5.The Input based on point section will only be displayed if, in the calibration table configuration, it was set that the reading of at least one variable would be Input based on point. In that case, use this section to collect measurements in different points of the same asset. For each point, then, it is necessary to enter the variable value. The C.T.V. column indicates the conventional true value of each point. For each variable, the system will display a column for all the points configured in the table. Enter the values in the respective fields. The values may be collected in the following ways:
▪Manually: The values must be entered manually in the columns of the meter reading spreadsheet itself. ▪Copy/Paste: The values can be copied/pasted from/to an Excel spreadsheet. For that, use the following buttons:
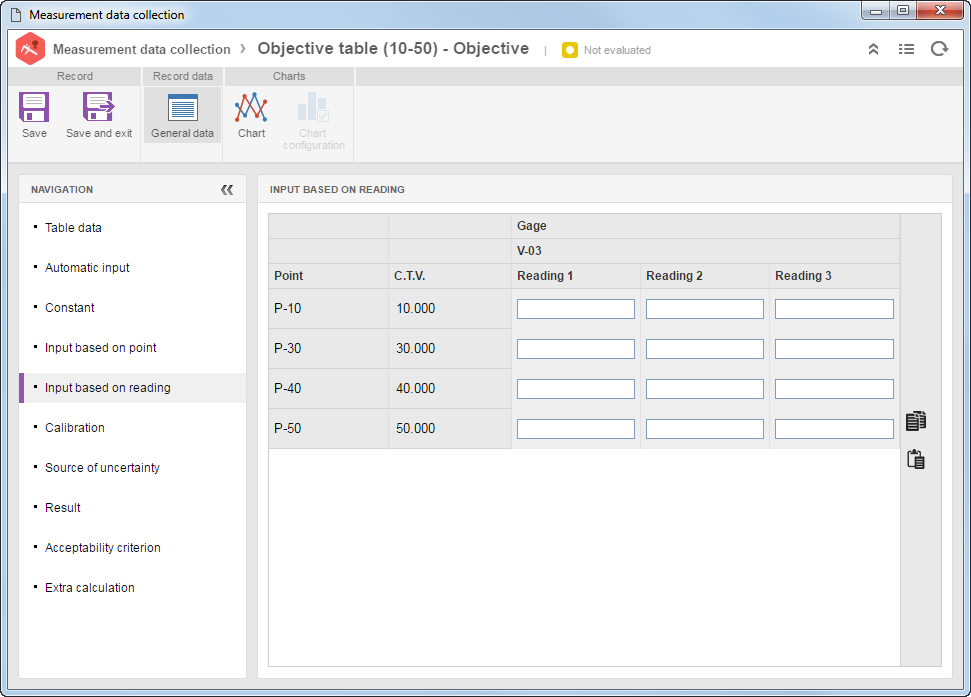
6.The Input based on reading section will only be displayed if, in the calibration table configuration, it was set that the reading of at least one variable would be Input based on reading. In that case, use this section to collect measurements based on reading, where the measurement of the same point is performed several times, which might generate different values. The C.T.V. column indicates the conventional true value of the point. For each variable, the system will display a column per reading for all the points configured in the table. Enter the values in the respective fields. The values may be collected in the following ways:
▪Manually: The values must be entered manually in the columns of the meter reading spreadsheet itself. ▪Copy/Paste: The values can be copied/pasted from/to an Excel spreadsheet. For that, use the following buttons:
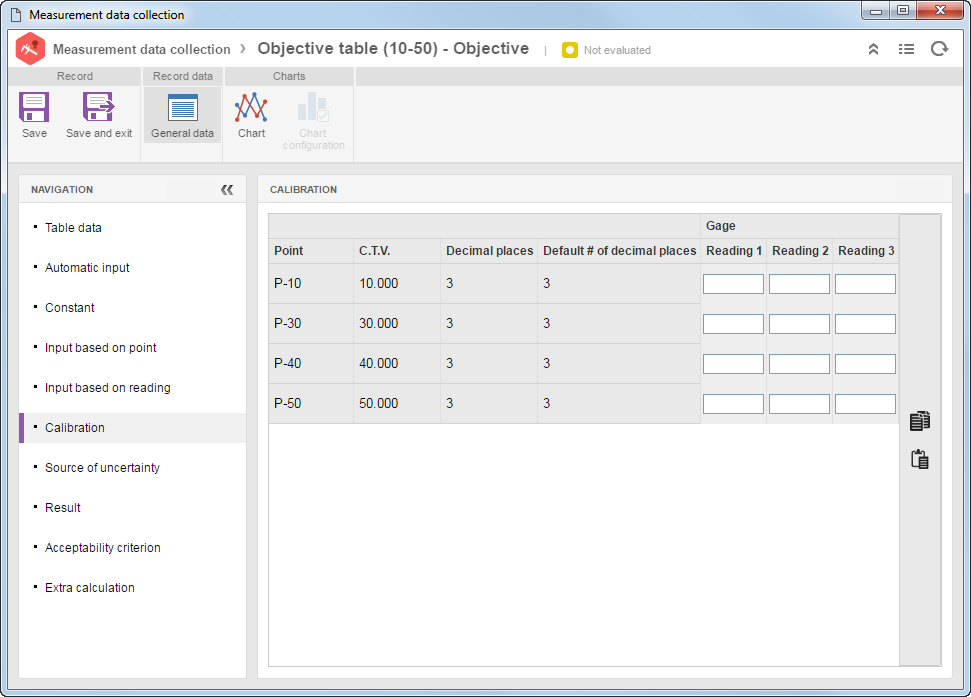
7.In the Calibration section should be entered the values obtained in the asset calibration. The quantity of available points depends on the calibration table in question. Remember that the calibration table is defined when configuring the standard activity. The values of the readings may be collected in the following ways:
▪Manually: The values must be entered manually in the columns of the meter reading spreadsheet itself. ▪Copy/Paste: The values can be copied/pasted from/to an Excel spreadsheet. For that, use the following buttons:
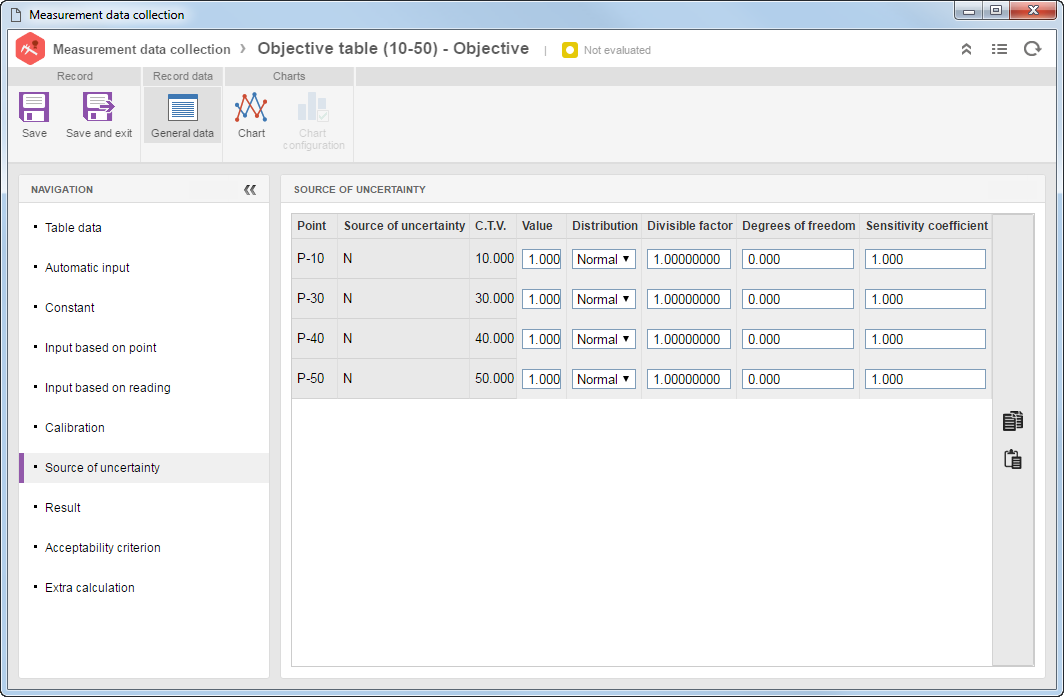
8.The Source of uncertainty section will only be displayed if the Type B uncertainty was selected in the standard activity of the calibration in question. A source of uncertainty is a factor that may influence the measurement result. Examples of sources of uncertainty are: changes in temperature, relative humidity, air pressure, variability in the technician performance, among others. This tab displays the values of the sources of uncertainty of the calibration points and the values of the uncertainties calculated automatically by the system:
9.Save the measurement collection, but do not close the data screen. At this point, the other sections will be updated with the values and results obtained in the measurement collection.
10.The Result section will only be displayed if the Control calibration result option was selected in the standard activity of the calibration in question. This section displays the results of the readings performed in the calibration points.
11.In the Acceptability criterion section, the values obtained in the criteria and the acceptable values are displayed. Through the acceptability criteria, it is possible to define the final status of the asset. Therefore, if the value obtained is within the range of acceptable values, the asset will be approved; otherwise, it will be rejected.
12.In the Extra calculation section, the extra calculations and their results are displayed. By means of these calculations, it is possible to obtain results for guideline purposes, with no relation with the acceptability criterion and with no calibration measurement approval/rejection.
13.To view the collection information graphically, click on the button in the Chart section.
14.Save the record. |