|
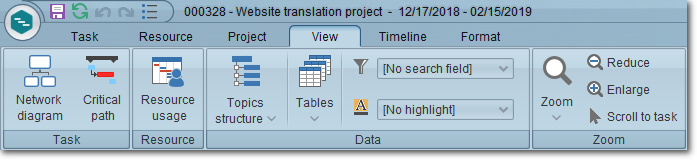
In this tab, the system makes available the options to configure the viewing of the information displayed in SE GanttChart, divided in the following sections:
Task
|
Network diagram
|
Click on this button to view the project tasks and their dependencies through boxes that make up an organizational whole and are displayed in the format of a network.
|
Critical path
|
Click on this button to view the sequence of tasks considered critical for the project. The critical path consists in a sequence of linked tasks that directly affect the end date of the project, i.e., if one of these tasks is past due, the project as a whole will also be. To hide the critical path of the project, simply click on the button again. Note that it may be displayed by default when accessing SE GanttChart, according to the definitions set on the Parameter tab of the vision data.
|
Resource
|
Resource usage
|
Click on this button to view the listing of resources allocated to the project tasks, as well as the distribution of their allocation.
|
Data
|
Topics structure
|
By clicking on the arrow located below this button, the following options regarding the display of the project structure will be displayed:
▪View: Select this option to expand the whole project structure. ▪Hide: Select this option to collapse the whole project structure. ▪Structure level: Select, among the displayed options, up to which level of the structure should be displayed expanded. Tasks in levels below the selected level will be displayed collapsed. |
Tables
|
Click on the arrow located below this button and check the options that correspond to the set of columns that should be displayed in the table are in SE GanttChart. For a set not to be displayed, keep the corresponding option unchecked. This operation can also be performed through the shortcut displayed by right-clicking on the name of a column in the table area. The available table options are:
▪Input: Displays the default column set of the tool: ID #, WBS, Name, Start, End, Duration, Responsibility, etc. ▪Control: Displays the column set of the actual values: Actual start, Actual end, Actual duration, Actual %, etc. ▪Finance: Displays the column set of the finances: Planned Cost/Resource/Revenue, rescheduled Cost/Resource/Revenue, and actual Cost/Resource/Revenue. ▪Critical path: Displays the column set of the critical path: Early Start/End, late Start/End, Total free time, etc. ▪Hours #: Displays the column set of the number of hours: Planned, rescheduled and actual time. ▪Summary: Displays the default column set of the task summary: Description, Explanation, Objective etc. ▪Display all: This option will only be enabled when using the shortcut. Displays all the columns with all the possible information referring to the tasks contained in the structure of the project. |
Filter
|
Select, in this field, the type of information that should be displayed in the vision. For example: Select the Milestone option for the system to display only milestone tasks in the vision (table and chart area).
|
Highlight
|
Select, in this field, the type of information that should be displayed highlighted in yellow in the table area. For example: By selecting the Milestone option, all milestone tasks contained in the project structure will be displayed highlighted in yellow in the table area.
|
View
|
Zoom
|
Click on the arrow located below this button to enlarge or reduce the time scale of the chart, i.e., to view the duration period of the project tasks in a broader or more detailed way. Note that the options displayed will vary according to the time format set for the project (Days or Hours). This operation can also be performed using the zoom slider, the shortcut "CTRL e +" or CTRL e -" on the keyboard, or through the "Enlarge" and "Reduce" options described below.
|
Reduce
|
Click on this button to reduce the time scale of the chart, i.e., to view the duration period of the project tasks in a broader way. This operation may also be performed through the zoom slide control or through the "CTRL -" keyboard shortcut.
|
Enlarge
|
Click on this button to enlarge the time scale of the chart, i.e., to view the duration period of the project tasks in a more detailed way. This operation may also be performed through the zoom slide control or through the "CTRL +" keyboard shortcut.
|
Scroll to task
|
Click on this button to access, directly in the chart, the period of the task selected in the list of tasks.
|
|