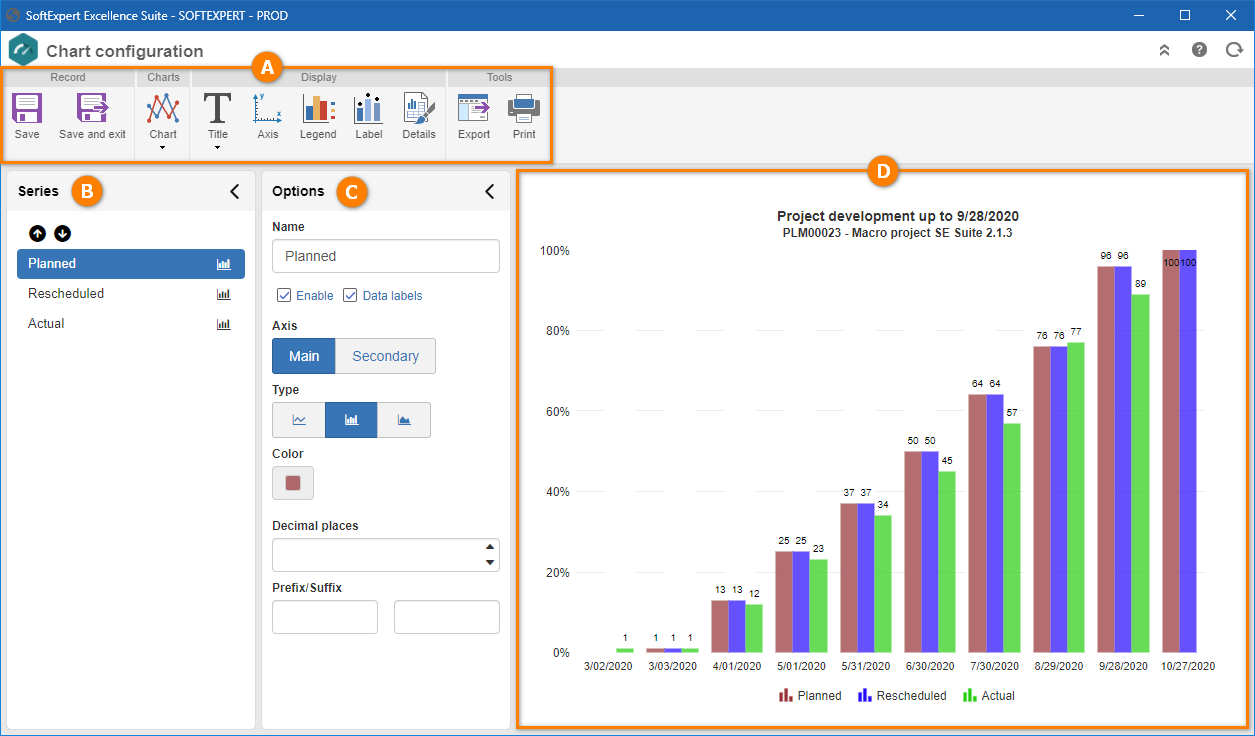
On the toolbar, use the options of the following palettes to manipulate the characteristics of the chart:
Record: Allows the user to save any changes they make by using the following options:
▪Save: Saves the changes and keeps the Chart Configuration window open. ▪Save and exit: Saves the changes and closes the Chart Configuration window. Charts: Click on the arrow below the Chart option and select the corresponding alternative to the appearance that the chart should display.
Display: Allows the user to manipulate the information that will be displayed on the chart by using the following options:
▪Title: Click on the arrow located under this option and on the screen that will be displayed, enter the title and/or subtitle that must be displayed in the chart. Click on the Advanced option on this screen, to format the title and/or subtitle as desired. ▪Axis: Click on this button to configure the data display of the horizontal and vertical axis of the graph. See more details in the Configuring axes section. ▪Legend: Click on this button to configure the display of the legend of the graph. See more details in the Configuring legends section. ▪Label: Click on this button to configure the display of the chart data labels. See more details in the Configuring data labels section. ▪Details: Click on this button to configure the background color, the grid lines and the border lining exhibition of the chart. See more details in the Configuring chart details section. Tools: Allows the user to export and print the chart by using the following options:
▪Export: Click on this button to have the chart exported in a .png image. ▪Print: Click on this button to print the chart. By clicking on this option, you will open the default print screen on the browser, allowing you to set the printer, the pages that will be printed, the number of copies and other desired properties.
|