Editing a process simulation |
|
|
To edit the information of a process simulation, access the Management
On the main screen toolbar, click on
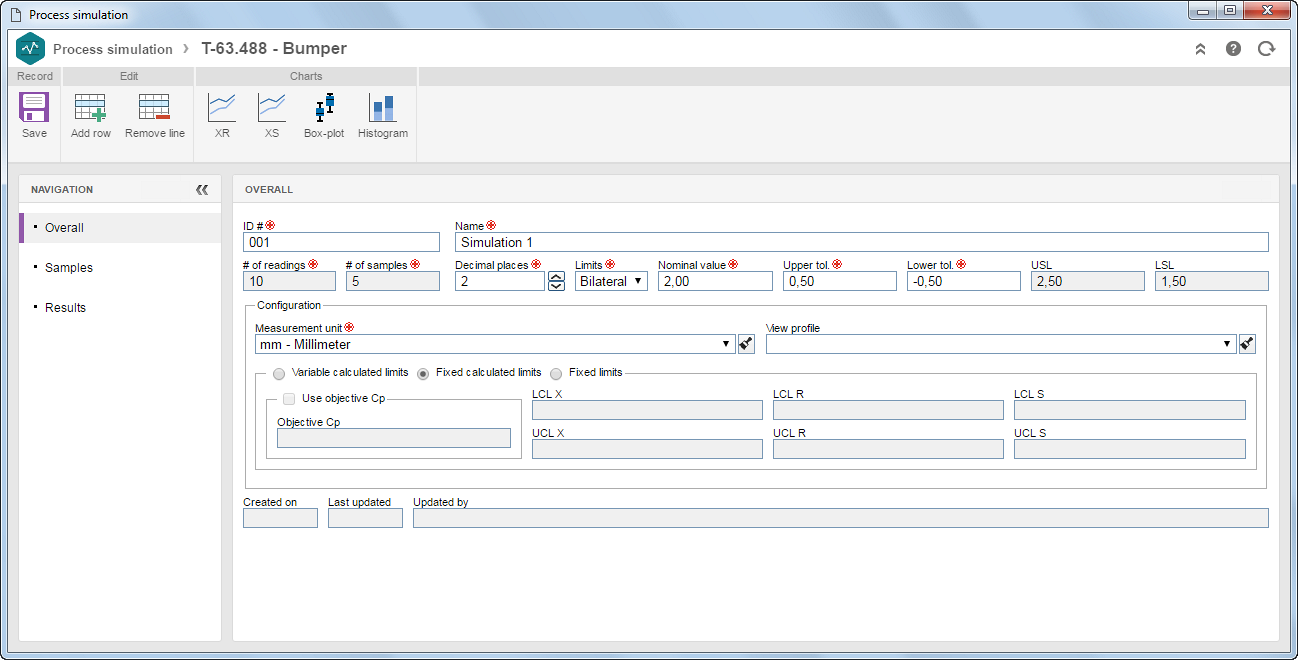
The following sections will be available:
GeneralOn addition to the data entered during the creation, the following fields will be available: ConfigurationsView profile: Select the view profile that will be used to view the charts. Variable calculated limits: Select this option for the limits to vary from sample to sample. Fixed calculated limits: Select this option so that the limit is the same for all samples. Fixed limits: Select this option for the limits to have the fixed values. In that case, the fields below will be enabled: ▪Use objective Cp: Select this field and define an Objective Cp that will be assigned to the capability index. ▪UCL X: This field will not be enabled if the Use objective Cp field is selected. Enter the upper control limit for the average chart. ▪LCL X: This field will not be enabled if the Use objective Cp field is selected. Enter the lower control limit for the average chart. ▪UCL R: Enter the upper control limit for the range chart. ▪LCL R: Enter the lower control limit for the range chart. ▪UCL S: Enter the upper control limit for the standard deviation chart. ▪LCL S: Enter the lower control limit for the standard deviation chart.
Samples Use this section to build the sampling spreadsheet according to the values defined in the Sample size and # of samples when creating the process simulation. Use the sampling spreadsheet to enter the values obtained in the readings of the characteristics. For that, add or remove lines for the samples through the respective buttons on the simulation screen toolbar.
Results Allows tracking the values and the charts/control charts generated from the values simulated for the characteristic in question. The results will only be displayed when all the sample spreadsheet data are collected, and the simulation screen is saved.
Save the changes made to this record. |