|
The charts are available in the Occurrences and Actions view menus. They are representations, with great visual appeal, of a relationship between variables. In a study, the information can be presented by replacing the numeric data of a search with drawings, line segments, curved lines, rectangles, etc., in order to make it easier and quicker to observe the results.
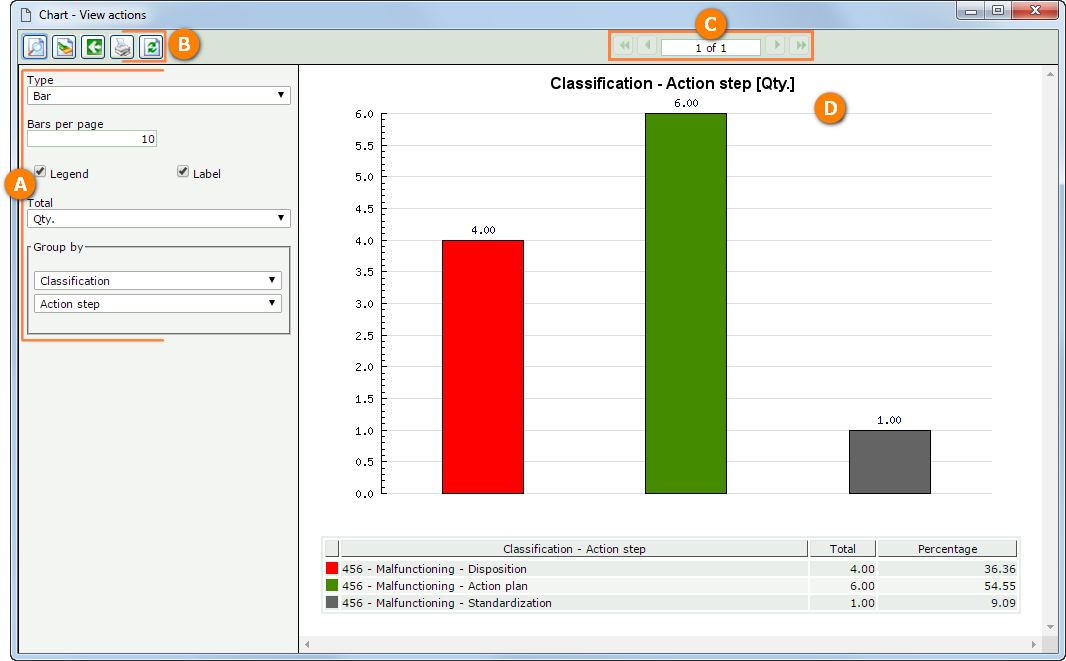
By clicking on the  toolbar button, the chart screen will be displayed, according to the following example: toolbar button, the chart screen will be displayed, according to the following example:
 This image refers to a chart issued from an action view. Thus, the displayed chart may vary according to the view or analysis being performed.
A
|
Type: Select the type of the chart that will be viewed. The following options are available: Bar, Horizontal bar, Line, Pie, or Pareto.
Bars per page: Enter the number of bars that will be displayed per page.
Legend: Check this option for the chart legends to be displayed. They will be displayed in the lower part of the chart.
Label: Check this option for the labels with the values to be displayed.
Total: Select how the total of the information presented in the chart will be calculated. The options available for selection vary according to the view being performed.
Group by: Select, in the fields in this section, the information that will be grouped to make up the chart itself. The options available for selection vary according to the view being performed.
|
B
|

|
Click on this button for the options configured in the side panel to be applied to the chart.
|

|
Click on this button to clear the values entered in the fields in the panel located on the left side on the main screen.
|

|
Click on this button to display/hide the panel located on the left side on the main screen.
|

|
Click on this button to open the printer configuration screen, through which it is possible to print the chart.
|
|
C
|
At the top of the screen, it is possible to view the number of pages the generated chart contains and navigate through them.
|
D
|
On the right side of the screen, the chart will be displayed, according to the configurations set before.
|
|


