Project progress |
|
|
The progress chart allows tracking and comparing what was planned, rescheduled and performed in the project. See how to access and view this information:
First, locate and select the desired project in the list of records. After that, click on the More
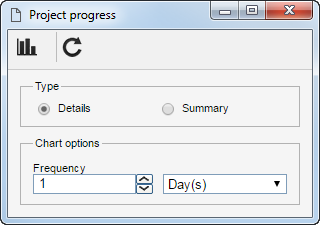
On the screen that will be displayed, define the information type that will be displayed in the chart:
Details: In the Chart options section, enter the frequency of days, weeks, or months that will be displayed on the project progress chart. Summary: In the Display section, keep checked only the options that should be displayed in the project progress chart: Planned, Performed and Actual.
Once done, click on the
At this point, the physical progress chart of the project will be displayed, and it is possible to edit its presentation. Refer to the Chart configuration section of the User guide document for more information on how to use this feature. |