Opening the event log |
|
|
See how to create an event log for a determined collected sample:
1.
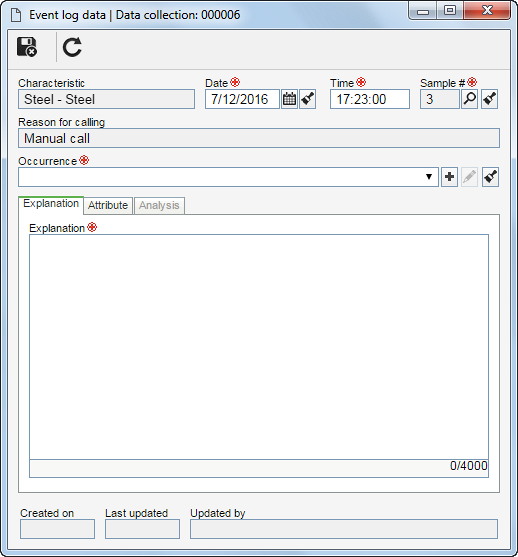
2.Fill in the following fields on the event log data screen: Characteristic: This field is filled in by the system with the name of the characteristic in which the occurrence is being created. Date: This field is filled in by the system with the occurrence record date. Time: This field is filled in by the system with the occurrence record time. Sample #: Select the number of the sample in which the anomaly was found. Reason for calling: This field is filled in by the system with the reason for calling this screen. When the event log is opened manually, this field will be filled in with "Manual call". Whereas when the event log is opened automatically, this field will be filled out with the name of the rule configured in the General parameters; for example: "P chart - Ascending or descending points trend". Occurrence: Select the occurrence that will be associated with the event log.
3.In the Explanation tab, enter the explanation for opening the event log in question.
4.In the Attribute tab, the system displays all the attributes that were associated in the Data collection configuration, through the Event log attribute tab, which may have been inherited from the configuration set in the General parameters. Required attributes must mandatorily have their values filled in for the record in the even log to be finished.
5.Save the record after filling in the fields above; however, do not close the data screen. At this point, the other tabs will be enabled to be filled out.
6.According to the integration configured in the General parameters for the treatment of occurrences found in the event logs, one of the following tabs will be displayed: Action planUse this tab to associate the action plan that will be used to treat the occurrence associated with the data collection event log. To do so, in the respective field, select the desired action plan. Remember that only the action plans in the planning step and that were not yet associated with an object will be available for selection (for example: calibration, FMEA, risk, etc.):
The activities of the action plan will be displayed in the list of records on this tab only after the data in the event log is saved for the first time.
NonconformityUse this tab to associate the nonconformities (occurrences) found in the data collection, which will be controlled through the SE Action component. Use the respective sidebar buttons to add or import the desired occurrences.
IncidentAllows associating the incidents found in the data collection, which will be controlled through the SE Incident component. Use the respective sidebar buttons to add or import the desired incidents:
ProblemUse this tab to associate the problems found in the data collection, which will be controlled through the SE Problem component. Use the respective buttons on the sidebar to add or import the desired problems:
7.In the Analysis tab, the system makes available some analysis tools to assist in the detection of the occurrences identified in the data collection of the measurements. See how to add these tools:
Save the event log record. |