Ishikawa diagram


Ishikawa diagram |


|
|
In the analysis carried out by means of the Ishikawa grouped by cause type diagram, causes are grouped by the type in which they are classified, thus allowing the identification of an unlimited quantity of causes for a determined effect. To access the Ishikawa grouped by cause type diagram screen, click on the
The analysis carried out by means of the Ishikawa diagram grouped by cause allows the identification of, at most, 6 causes for each problem. This process is used for less precise and simpler analyses. To access the Ishikawa grouped by cause diagram screen, click on the
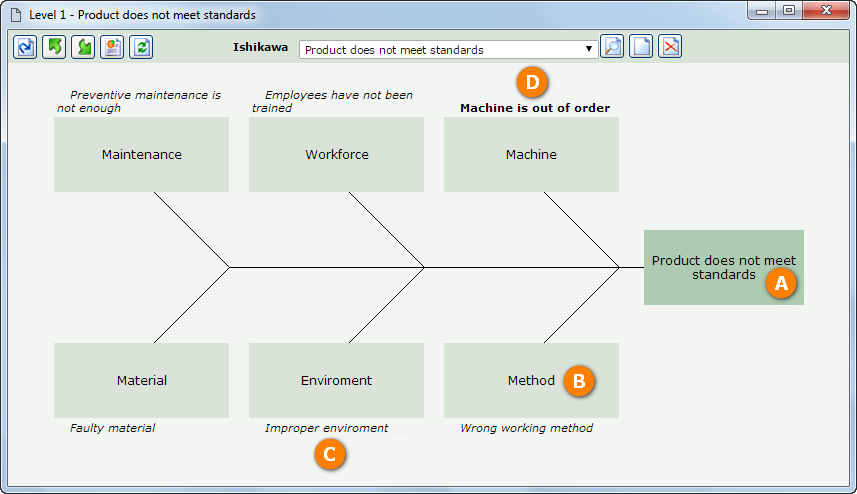
The screen will be displayed according to the image below. The alphabetical letters identify each available item:
 This image refers to an Ishikawa diagram grouped by cause type. The Ishikawa diagram grouped by cause is similar.
In the Ishikawa diagram grouped by cause type, the light-green rectangles will be automatically displayed with the cause types that have been configured through the Configuration
On the toolbar, the following buttons are available:
|