|
See how to view the usage chart of a resource:
1.
|
Locate and select the desired resource in the scheduling wizard.
|
2.
|
In the Chart palette, click on the Histogram option.
|
3.
|
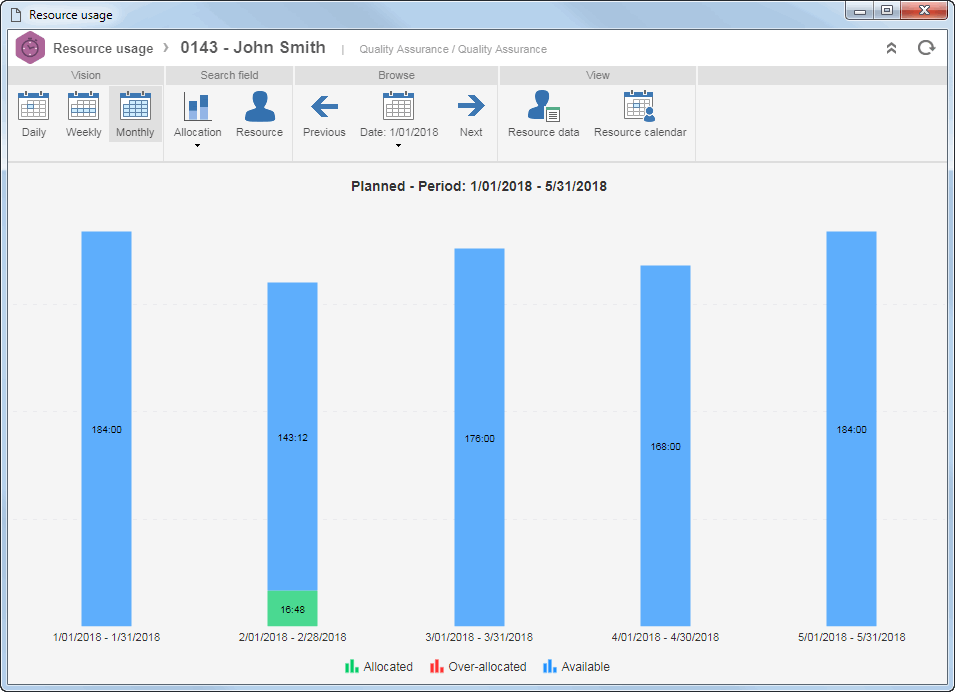
At this point, the histogram screen will be displayed:

|
4.
|
On the toolbar, the following palettes are available:
Vision
|
Daily
|
Click on the corresponding button to change the resource usage vision.
|
Weekly
|
Monthly
|
Filter
|
Allocation
|
Click on the arrow located below this button to define whether the planned or rescheduled allocated hours will be displayed of the resource in question.
|
Resource
|
Click on this button to view the histogram of another resource without having to leave the chart screen. On the screen that will be displayed, locate and select the resource whose histogram you wish to view.
|
Browse
|
Previous
|
Click on this button to view the resource usage in a period previous to what was displayed.
|
Date
|
Click on the arrow located below this button and select the date in which you wish to view the resource usage.
|
Next
|
Click on this button to view the resource usage in a period later than what was displayed.
|
View
|
Resource data
|
Click on this button to view the data of the resource whose histogram is being viewed.
|
Resource calendar
|
Click on this button to view the calendar of the resource whose histogram is being viewed. See further details about the screen that will be displayed in the My calendar section.
|
|
|


