B
|
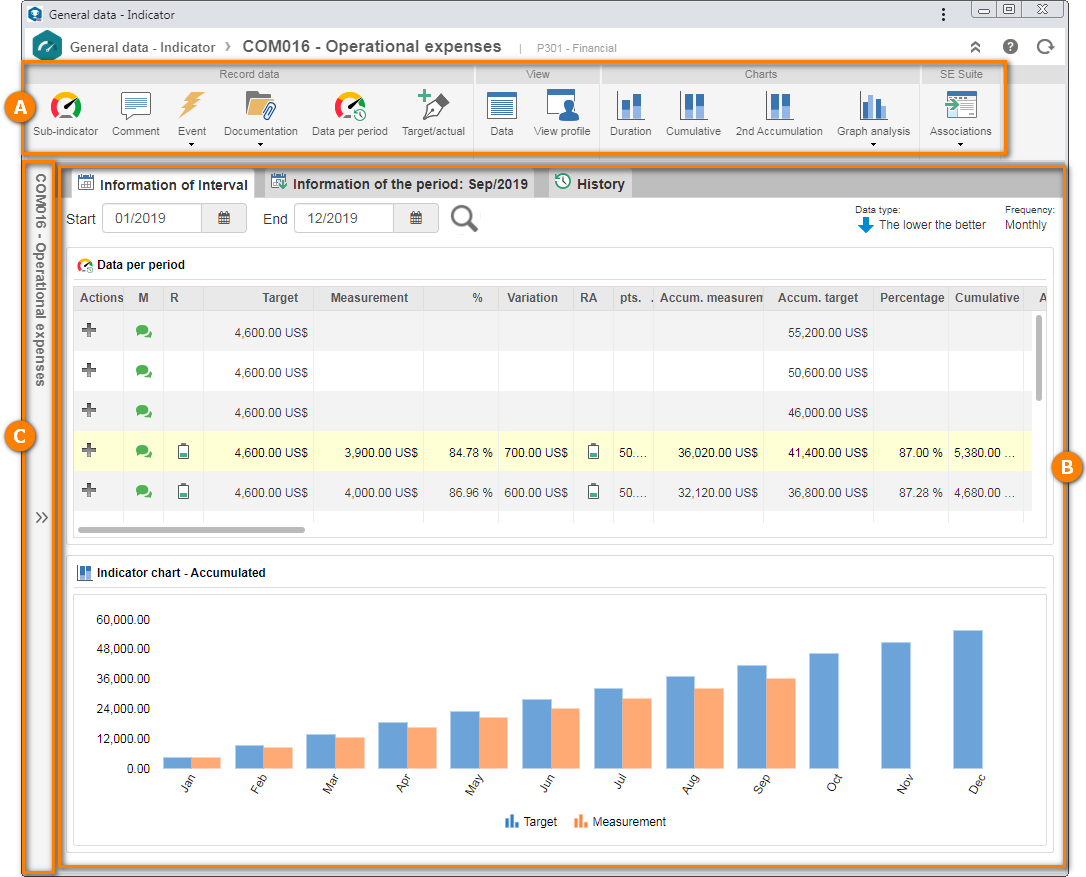
On the lower part of the screen, the record details are displayed divided in tabs and panels. By default, the following tabs are displayed:
▪Interval information: Allows obtaining an overview of the record in a certain time interval. For that, at the top of this tab, select the start and end dates of the desired interval and click on the  button. The upper part of this tab also displays the item that is above the item in question in the structure, the date of its latest update, its classification and frequency. The lower part displays the panels defined in the "Indicator/element details" tab of the view profile applied to the indicator. button. The upper part of this tab also displays the item that is above the item in question in the structure, the date of its latest update, its classification and frequency. The lower part displays the panels defined in the "Indicator/element details" tab of the view profile applied to the indicator. ▪Information of the period: Allows viewing the indicator information during a certain time. To do this, at the top of this tab, select the period of the desired indicator. At the bottom of this tab, the gauge applied to the record with the information of the period, accumulation and 2nd accumulation of it will be displayed by default. The way the values will be displayed in the gauge (percentage or score) has been set in the view profile. The gauge will be the one associated with the range related to the record. If the record is an indicator and it has been defined that it will use the default scale when adding it to the scorecard structure, the intervals displayed in the gauge will be those configured in the range. Otherwise, the intervals will be those set at time of the input. ▪History: This tab will only be displayed if the record whose details are being viewed is an indicator. It allows viewing and commenting on the main events that occurred up to the current date in a timeline. The displayed events may be, for example: target and measurement calculation, addition of comments, generation of events, addition of attachments, etc. Note that, in order to be able to add, edit and delete comments, the user must have the Edit (Details) control allowed in the security of the indicator/element. The user will only be able to edit and delete their own comments. Depending on the option selected on the toolbar, a panel will be added to the selected tab, allowing the user to track or execute the desired operation. When hovering over the top right corner of the panel, the options that allow you to reload your information, minimize it, maximize it, move it up, move it down, expand it in full-screen mode, export your graphic to PNG., Delete it from the tab, etc. will be displayed.
|


