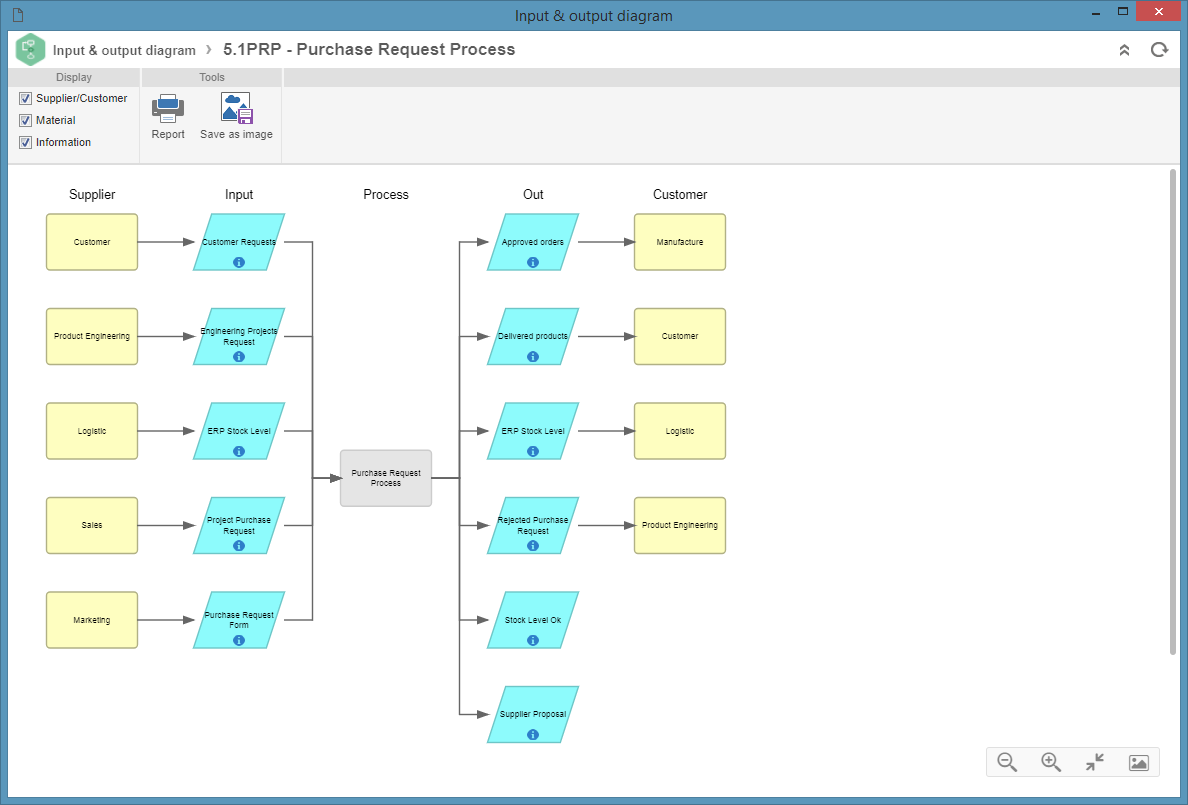
This diagram, as the name suggests, aims to present all the inputs and outputs of materials and information that occurred in the process items, as well as stakeholders.
Supplier: The suppliers of the Materials/Information of each entry are being listed in the Supplier column. Each rectangle in this region represents a vendor.
Input: The Inputs column contains all the information or materials used by the process. Each parallelogram in this region represents an input. Click on the item to open its data screen.
Out: The Outputs column contains all the information or materials generated by the process. Each parallelogram in this region represents an output. Click on the item to open its data screen.
Process: The Process column displays the process item in question. If this process has sub-processes, they may be viewed (in an input & output diagram, or a new tab) when expanding the process through the  icon. Click on the item to open its data screen. icon. Click on the item to open its data screen.
Customer: In the Customer column, customers of the Materials/Input information are being listed. Each rectangle in this region represents a customer.
Remember that the information and material input and output are associated on the process or activity data screens.
|
|