Configuring axes |
|
|
See how to configure the chart axes:
1.In the Display palette on the toolbar, click on the Axis option.
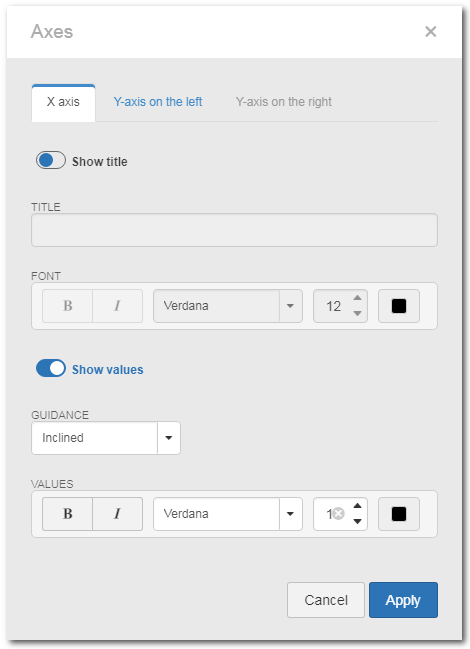
2.On the screen that will be displayed, select the tab that corresponds to the axis you want to configure: X axis (horizontal), Y-axis on the left (vertical) or Y-axis on the right (secondary vertical):
3.In the selected tab, fill out the following fields:
Show title: Enable this option to set a title for the axis. The following fields will be enabled: ▪Title: Enter a title for the axis. ▪Font: Use the options in this field to perform the desired formatting in the title font of the axis. ▪Orientation: This field will only be displayed if the tab selected during step 02 is "Y-axis on the left" or "Y-axis on the right". In this case, select the orientation you want to display the title of the Y axis of the chart: vertical or horizontal. Show values: This field will only be displayed if the tab selected during step 02 is "X axis". Enable this option for the axis values to be displayed in the chart. The following fields will be enabled: ▪Orientation: Select the desired orientation for the display of the axis values of the chart: vertical, horizontal, or inclined. ▪Values: Use the options in this field to perform the desired formatting in the font of the values of the axis. Limits: This section will only be displayed if the tab selected during step 02 is "Y-axis on the left" or "Y-axis on the right". Enable the Automatic option for the system to define the limits of the axis in the chart. Disable it to customize the limits of the vertical axes. In this case, in the available fields, enter the lower and upper values that will limit the axis. Scale range: This section will only be displayed if the tab selected during step 02 is "Y-axis on the left" or "Y-axis on the right". Use this field to configure the range between the lines that must be applied to the scale. When the scale range is defined, the line quantity configuration will be disabled in the "Grid lines" tab in the chart details configuration screen. Abbreviate values: This option will only be displayed if the tab selected during step 02 is "Y-axis on the left" or "Y-axis on the right". By default, it will be displayed as disabled. Enable it so that, when the axis values are very extensive, they are presented in a short form. Synchronize axes: This option will only be displayed if the tab selected during step 02 is "Y-axis on the left" or "Y-axis on the right" and if at least one of the chart series is configured to be displayed in the secondary axis. Enable it so that, if the Y axes on the left and on the right are configured, they have the same value. If this option is not enabled, the axes values may be different.
4.After making the necessary configurations, click on the Apply button at the bottom of the screen. Use the Cancel button, or the "Close" option on the top corner of the screen, to get out of it without saving the changes performed. |