Drilling up |
|
|
The drill up operation takes place when the user increases granularity degree and decreases the level of data details. See how to perform drill up in the analysis environment of SE Analytics through the example below:
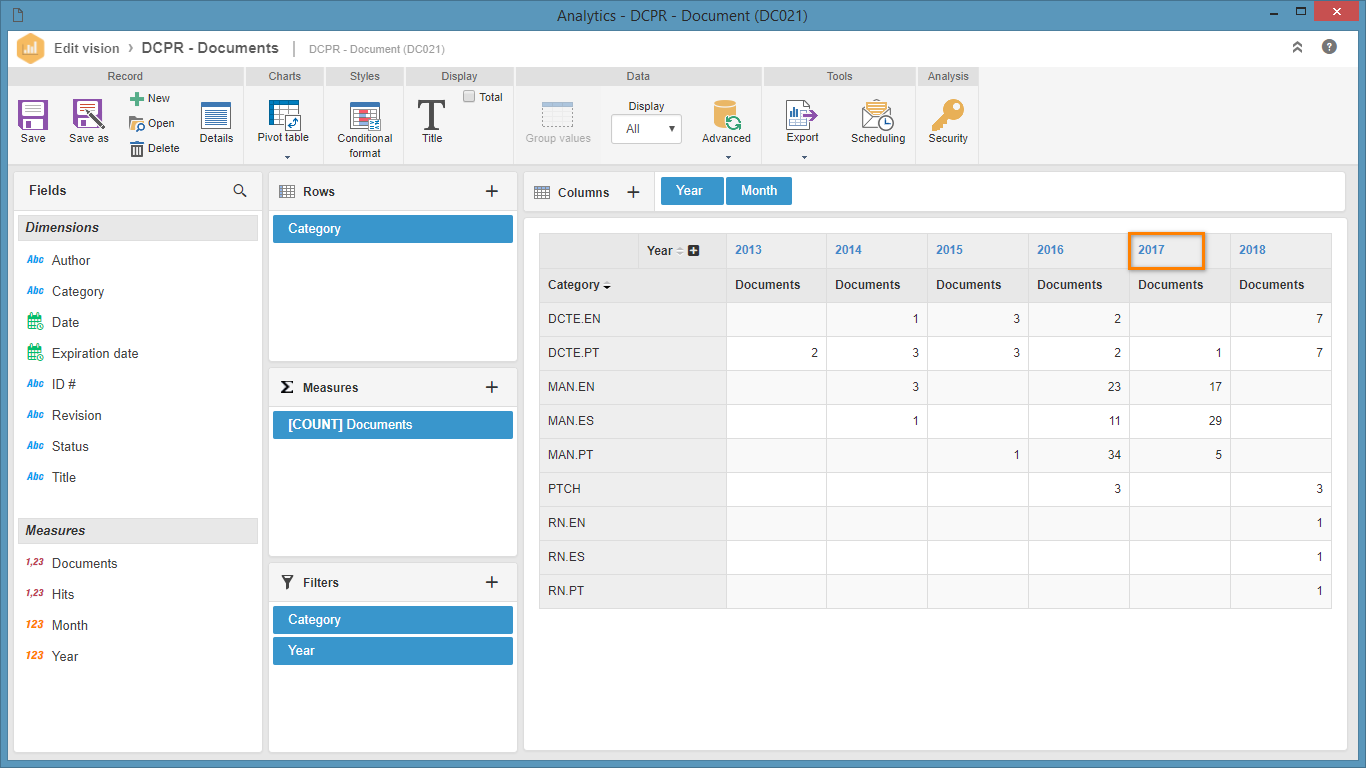
In the vision screen, whether it is from a component or an SQL command, drag the necessary fields to the analysis areas. In the next image the view document menu will be used, with a pivot table type analysis. The "Year" and "Month" field were dragged to the columns, respectively. "Category" field was dragged to the lines. In the filters were added the "Year" and "Category" fields only to restrict the values presented in the vision:
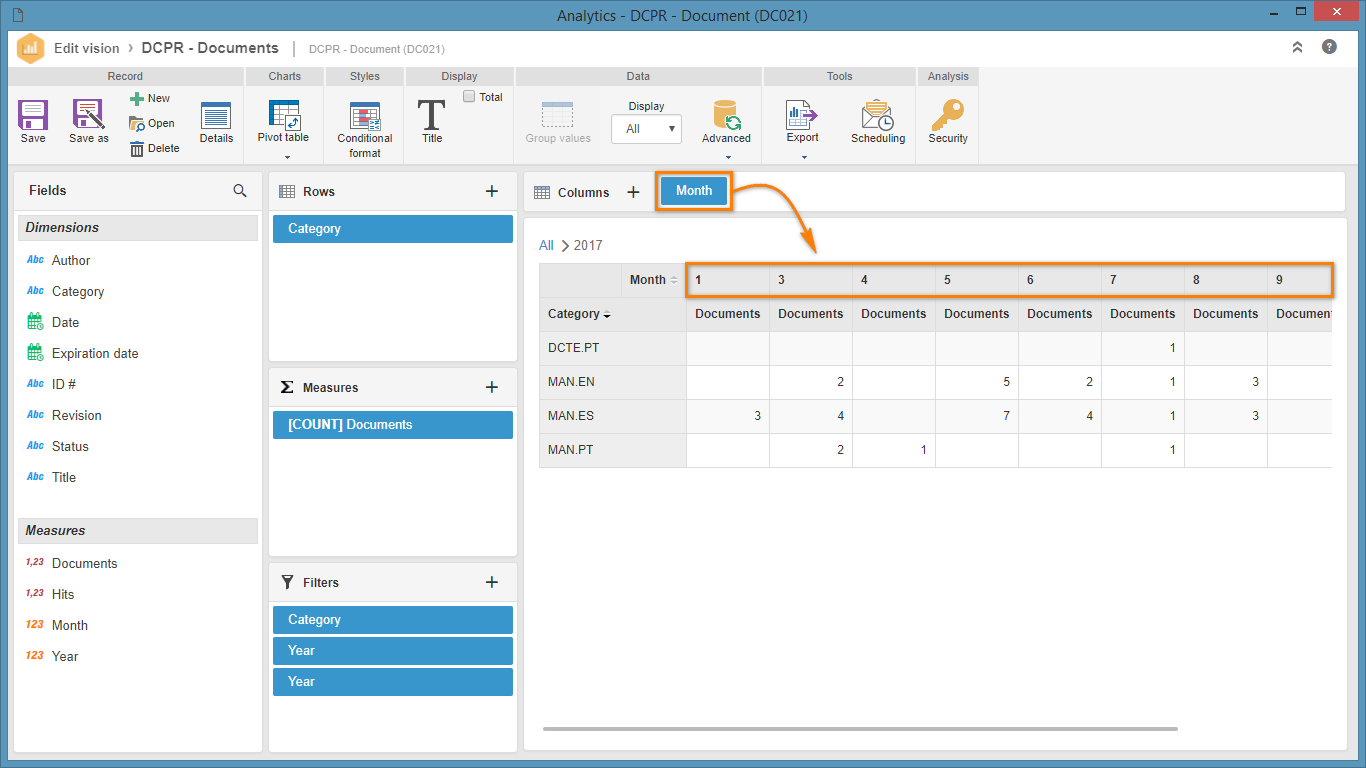
Notice that the title of the "Year" column is typed with a different font from the other vision fields. When the user types on one of the years, for example, 2017, the analysis will display the number of revisions that were performed each month of selected year:
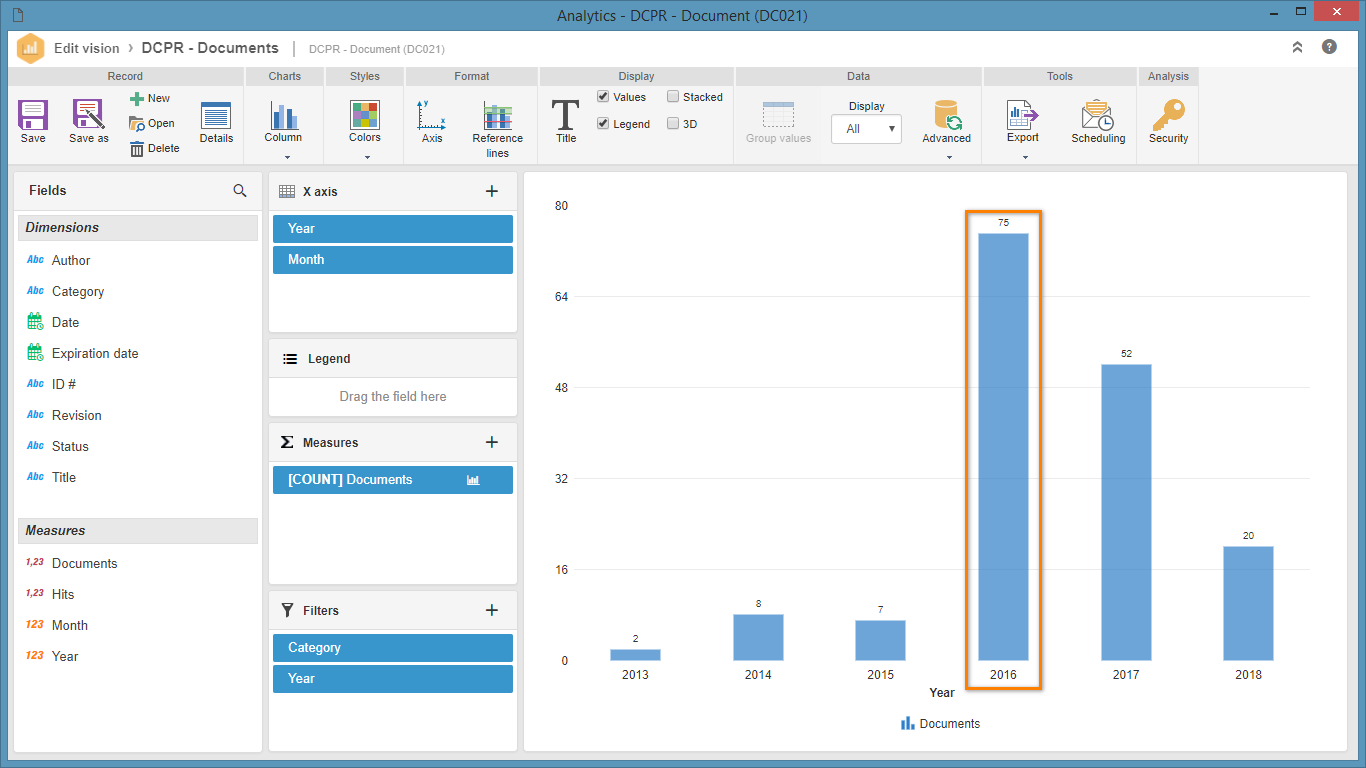
This also occurs for other types, such as column chart:
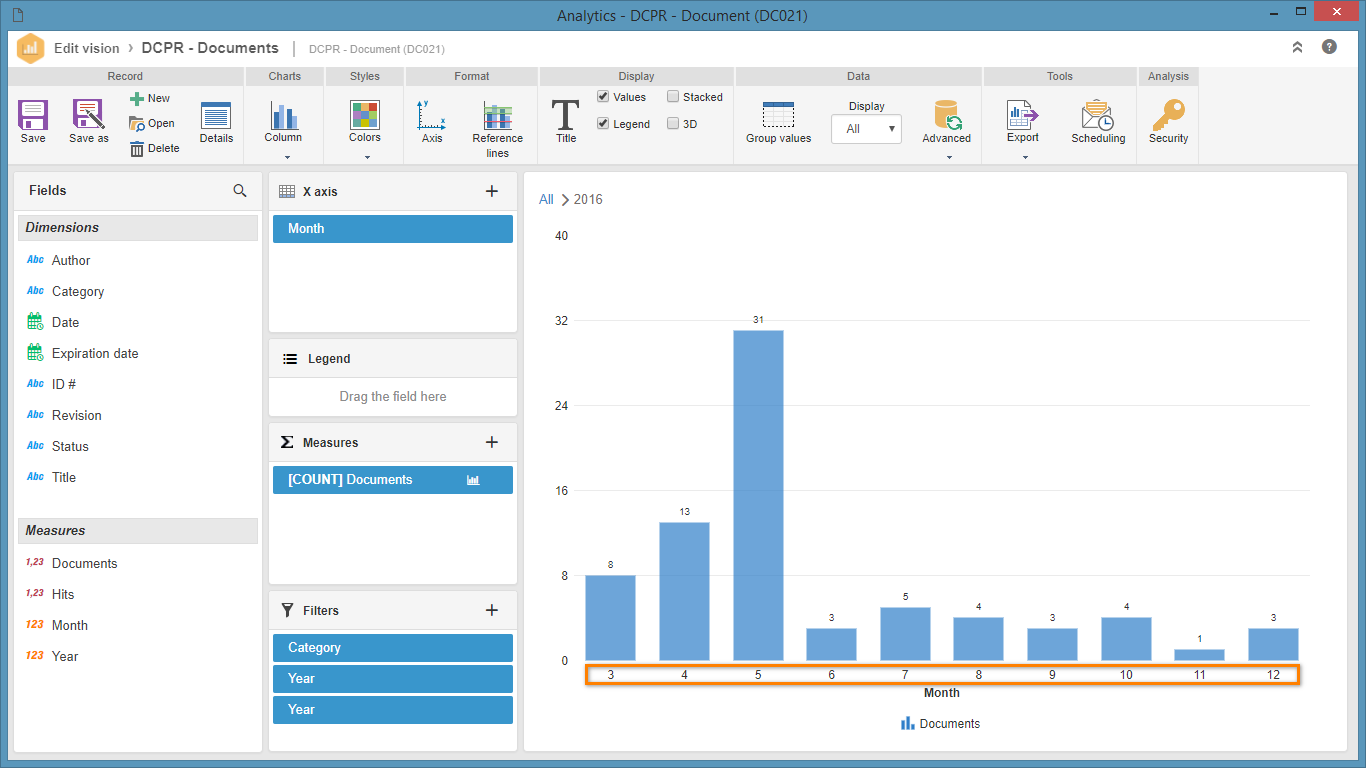
When the user clicks on one of the "Year" columns, the analysis will load a second column chart with the number of revisions performed on each month of the selected year:
|