|
The SE Kanban widgets aim to help in the process of analyzing tasks. The charts use the Analytics structure, which allows a great flexibility to change information as necessary, such as applying filters or adjustments to the charts. To do that, create or edit a Portal and associate one or more SE Kanban widgets:
For more information on how to follow, create, edit, share, or copy a portal, refer to the "User guide  Tools Portals" section. Tools Portals" section.
|
The logged user will view the knowledge bases and articles according to the language in which the system is being accessed. If the language of the user is enabled in the knowledge base and the articles are recorded in this language, these articles will be displayed in the language of the user; otherwise, the system will use the base language to display the articles.
|
The cumulative flow diagram or CFD is a tracking chart regarding what happens during the task flow. With the chart, it is possible to understand the evolution of the process by tracking the number of tasks to be performed, tasks in progress and finished tasks. The chart is divided for each step of the flow, allowing the analysis of possible attention points in the flow.
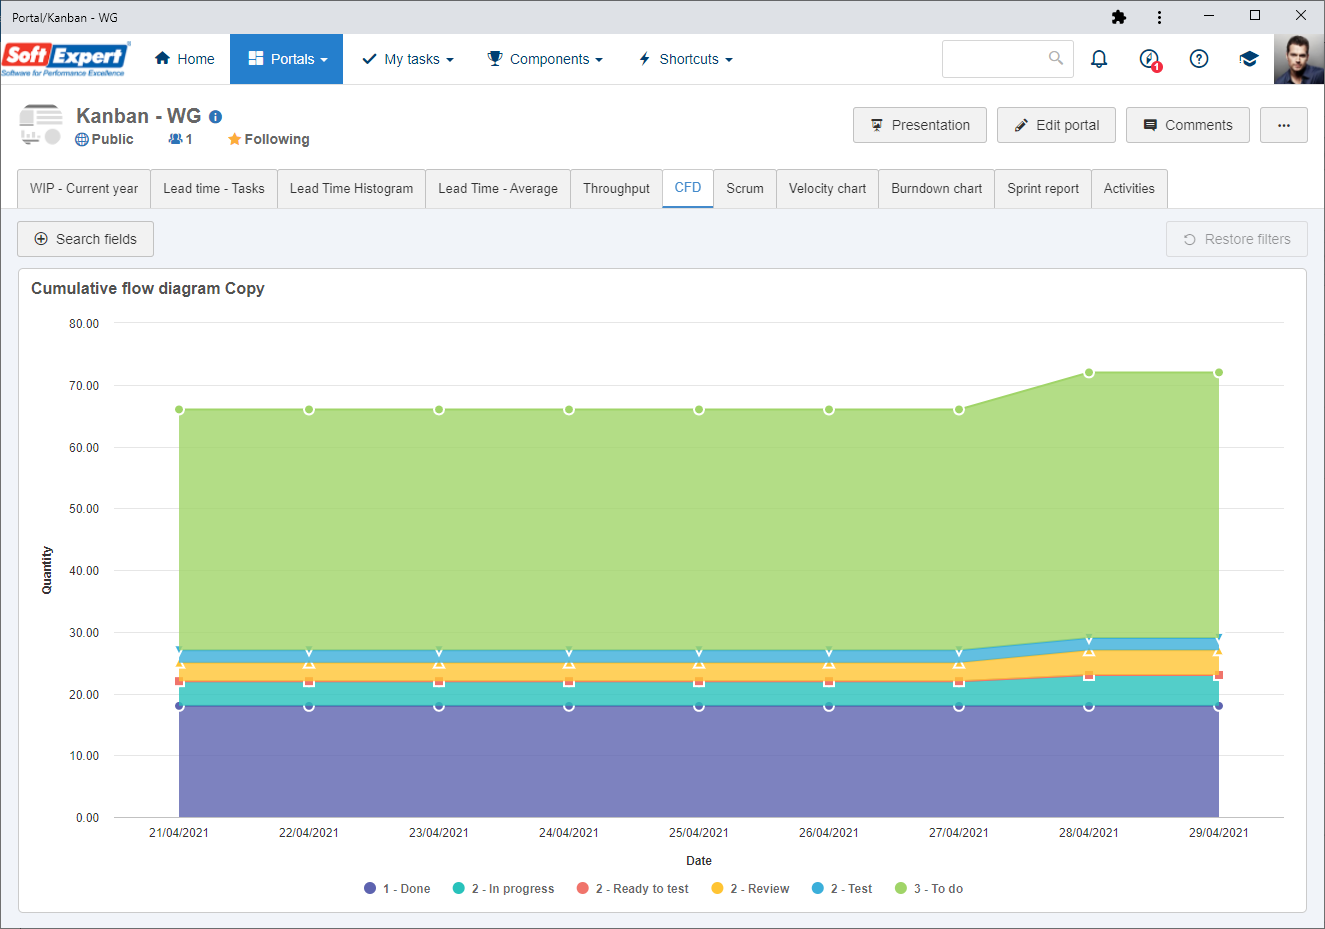
If it is necessary to perform any adjustments to the chart or to apply any filters, click on the "Edit" button on the upper right corner of the widget. At this point, the OLAP (Analytics) screen will be displayed, allowing the customization of fields (dimensions and/or measurements) of the vision that generates the cumulative flow diagram.
|
|
The burndown chart allows analyzing the delivery flow of an active sprint. It displays the total effort estimated at the start of the sprint compared to the number of delivered tasks. With this analysis, the user can see if the planned task delivery rate is in accordance with the time left until the end of the sprint, allowing them to understand whether the schedule will be met and facilitating the analysis of the need for possible planning or process changes.
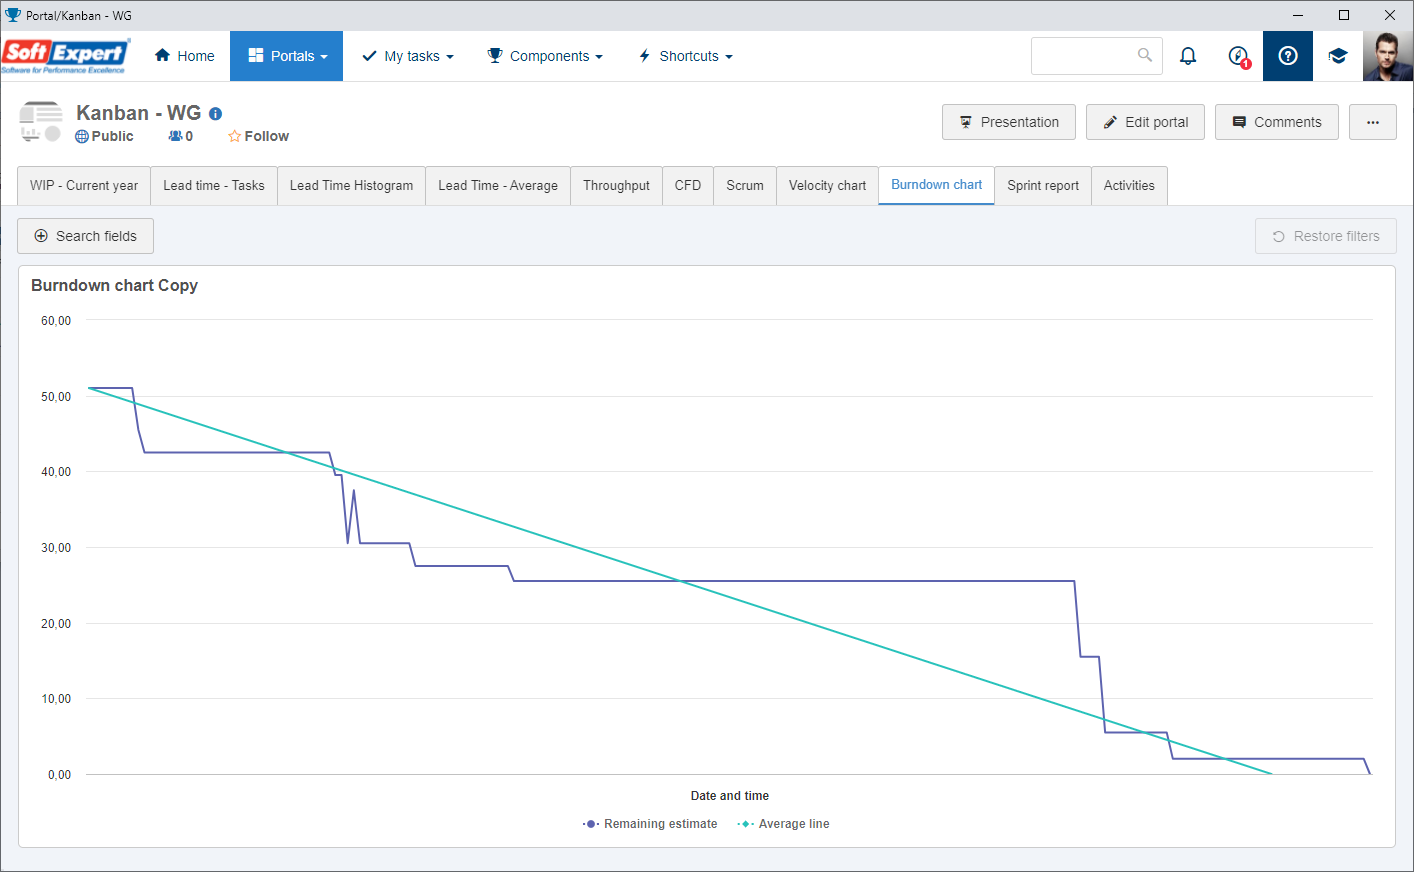
If it is necessary to perform any adjustments to the chart or to apply any filters, click on the "Edit" button on the upper right corner of the widget. At this point, the OLAP (Analytics) screen will be displayed, allowing the customization of fields (dimensions and/or measurements) of the vision that generates the burndown chart.
|
|
The throughput widget represents the number of tasks finished within a certain period. With this chart, it is possible to analyze the deliveries of the period, checking if the tasks are being finished or if the number of delivered tasks is increasing or decreasing.
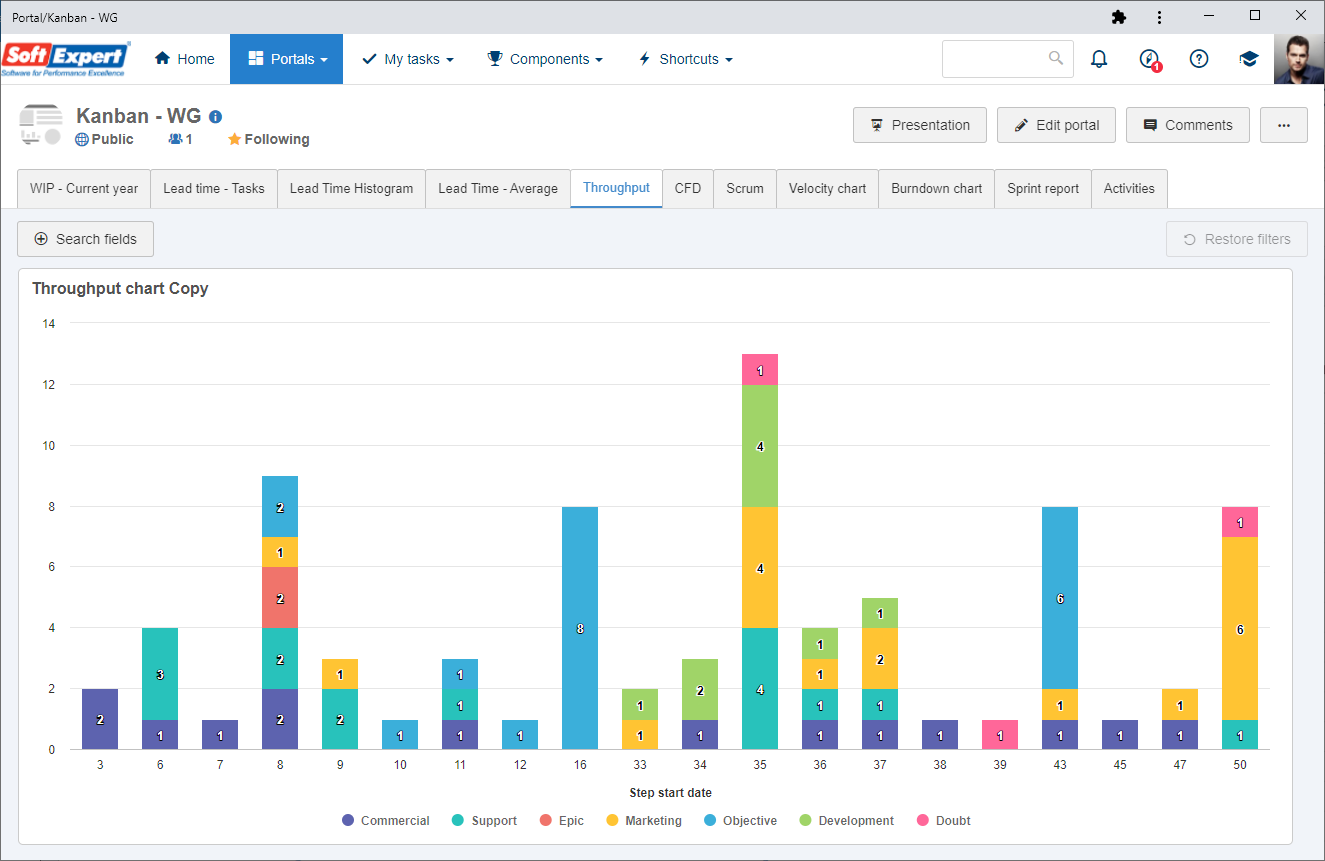
If it is necessary to perform any adjustments to the chart or to apply any filters, click on the "Edit" button on the upper right corner of the widget. At this point, the OLAP (Analytics) screen will be displayed, allowing the customization of fields (dimensions and/or measurements) of the vision that generates the throughput chart.
|
|
The velocity chart allows tracking the quantity of finished work among the sprints. This analysis helps determine the velocity of the team of a workspace and estimate the work that the team can realistically perform in future sprints.
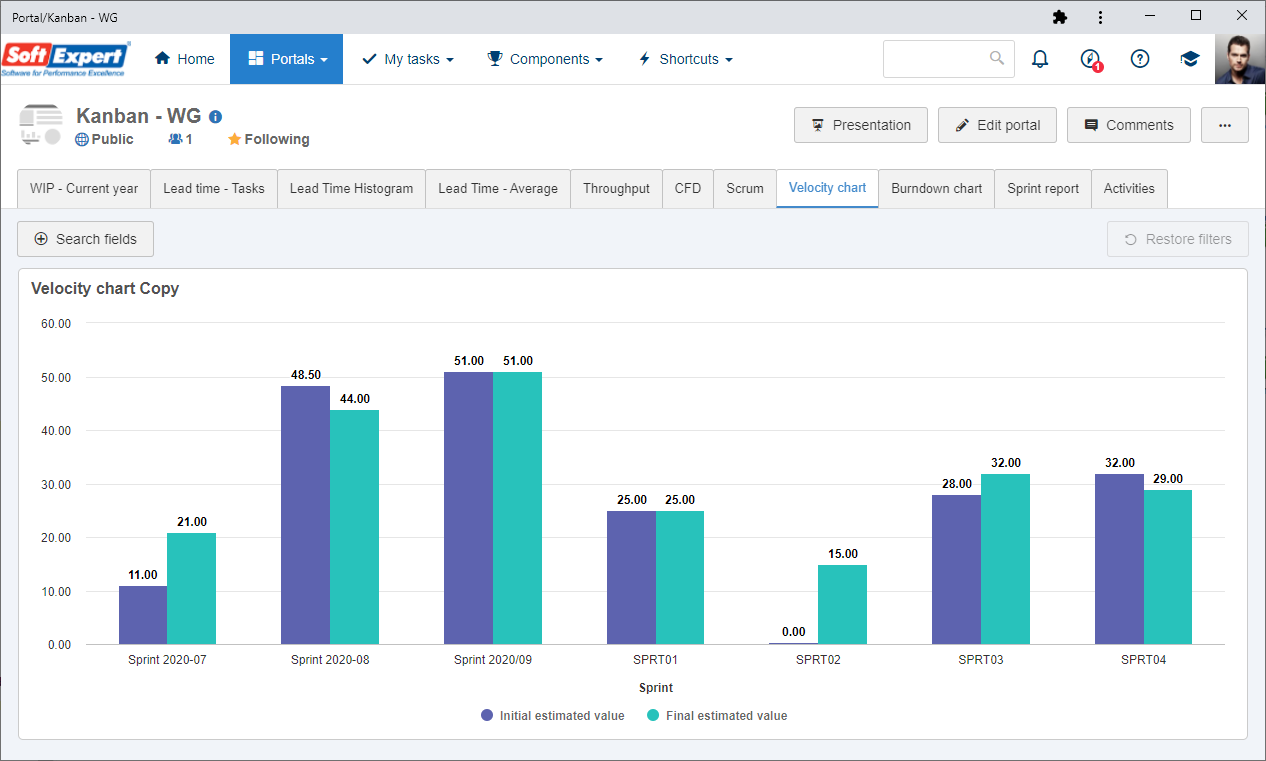
If it is necessary to perform any adjustments to the chart or to apply any filters, click on the "Edit" button on the upper right corner of the widget. At this point, the OLAP (Analytics) screen will be displayed, allowing the customization of fields (dimensions and/or measurements) of the vision that generates the velocity chart.
|
|
The lead time histogram displays information of tasks grouped by their lead time. This analysis allows tracking whether there is a lot of variation in the process, as well as identifying attention points within the flow, as it becomes easier to identify tasks with a higher lead time than normal.
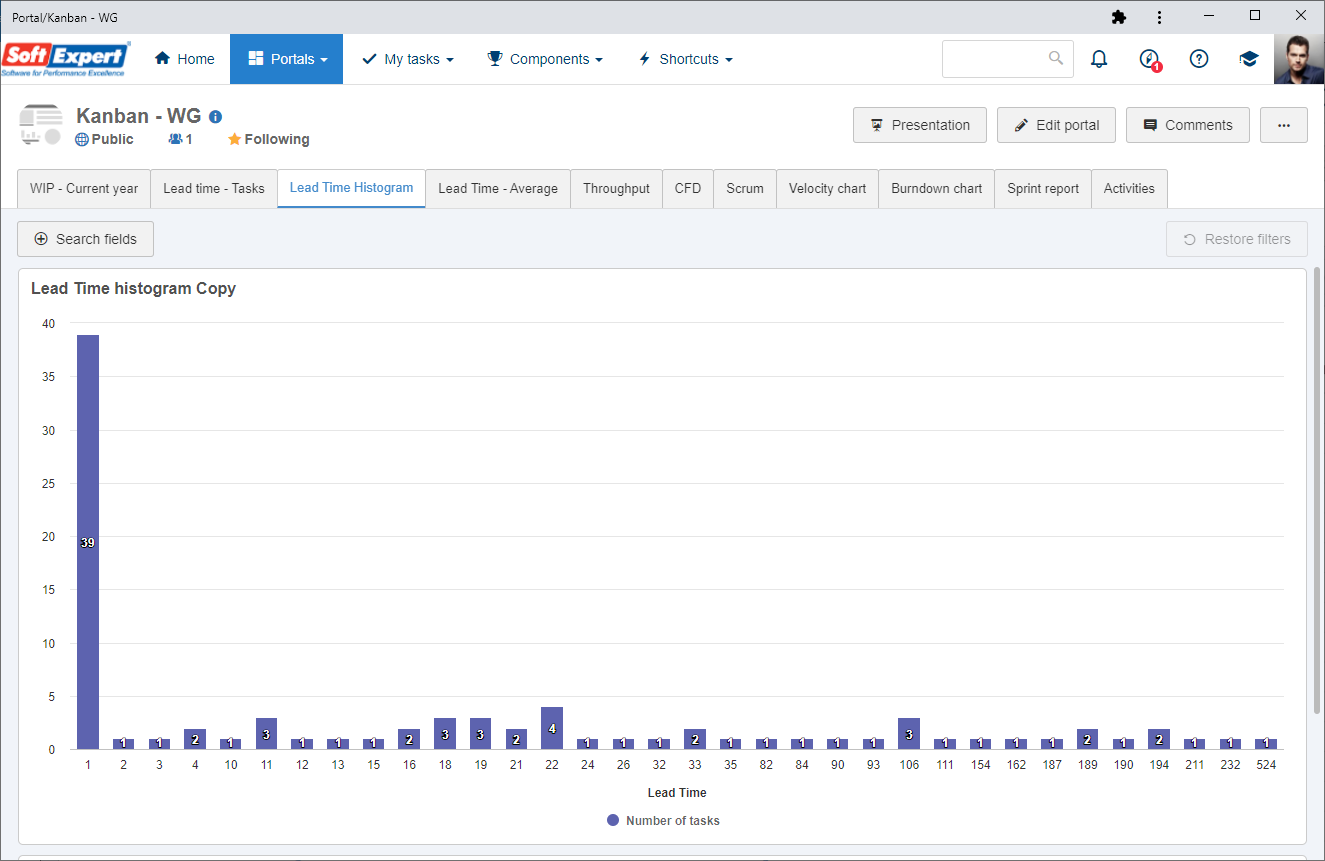
If it is necessary to perform any adjustments to the chart or to apply any filters, click on the "Edit" button on the upper right corner of the widget. At this point, the OLAP (Analytics) screen will be displayed, allowing the customization of fields (dimensions and/or measurements) of the vision that generates the lead time histogram.
|
|
The average lead time per period chart displays the evolution of the lead time throughout time, using as information the lead time average of the period.
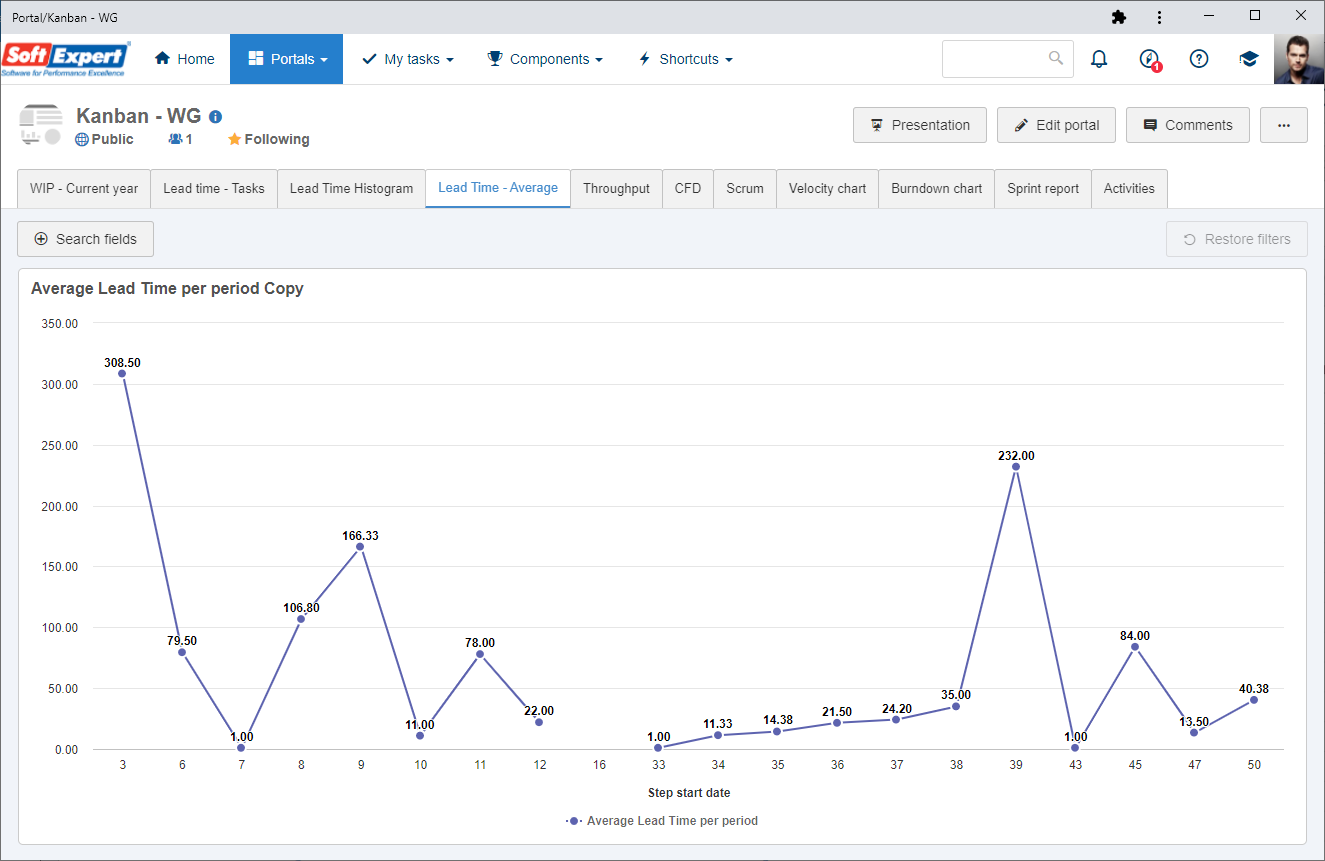
If it is necessary to perform any adjustments to the chart or to apply any filters, click on the "Edit" button on the upper right corner of the widget. At this point, the OLAP (Analytics) screen will be displayed, allowing the customization of fields (dimensions and/or measurements) of the vision that generates the average lead time per period.
|
|
The lead time widget displays the total duration time of a task from its creation to its closure. This analysis allows individually tracking each tasks, allowing a more detailed analysis in situations that may deviate from the process. In addition to the displayed information, if necessary, it is possible to stratify the time into hours, as well as the time in each step of the flow, facilitating the identification of bottlenecks in the flow.
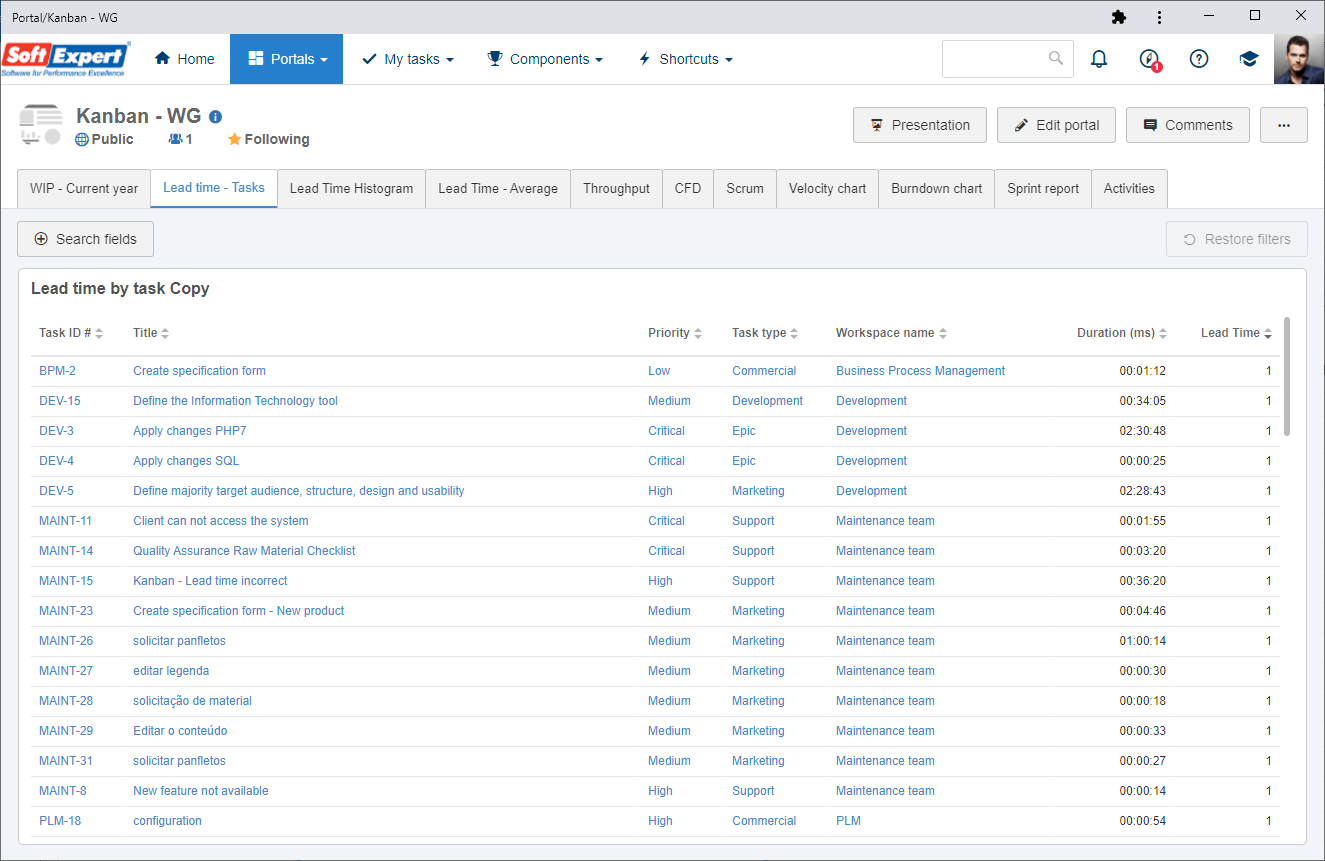
If it is necessary to perform any adjustments to the chart or to apply any filters, click on the "Edit" button on the upper right corner of the widget. At this point, the OLAP (Analytics) screen will be displayed, allowing the customization of fields (dimensions and/or measurements) of the vision that generates the lead time by task chart.
|
|
The sprint report displays, through a table, the information related to the sprints registered in the system. This analysis allows stratifying the information of a sprint to understand the evolution of its tasks, as well as verifying the changes in the plan.
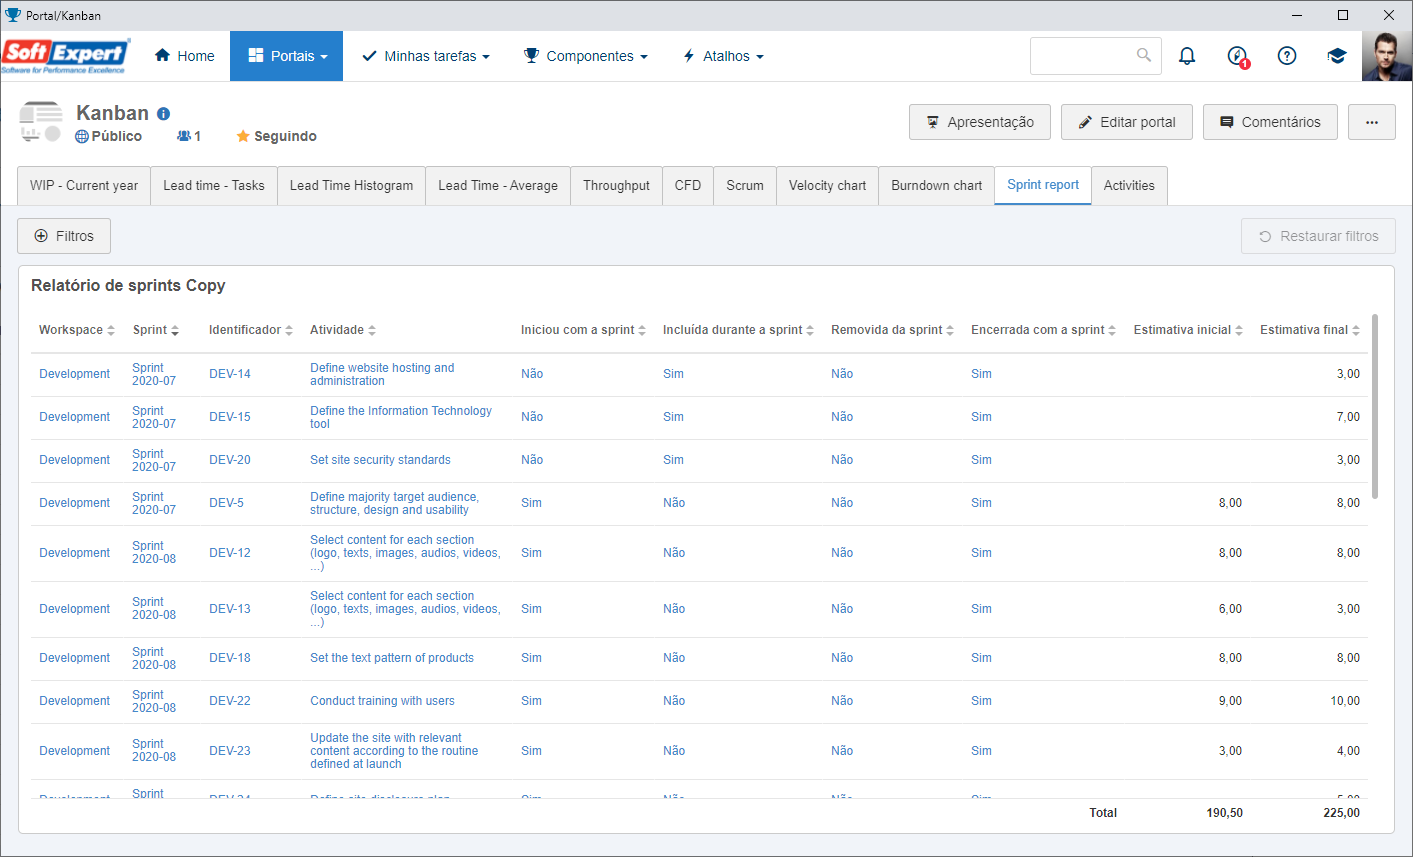
If it is necessary to perform any adjustments to the chart or to apply any filters, click on the "Edit" button on the upper right corner of the widget. At this point, the OLAP (Analytics) screen will be displayed, allowing the customization of fields (dimensions and/or measurements) of the vision that generates the sprint report.
|
|
|