Configuring legends |
|
|
Here's how to configure the display of graph legends:
1.In the Display palette on the toolbar, click on the Legend option.
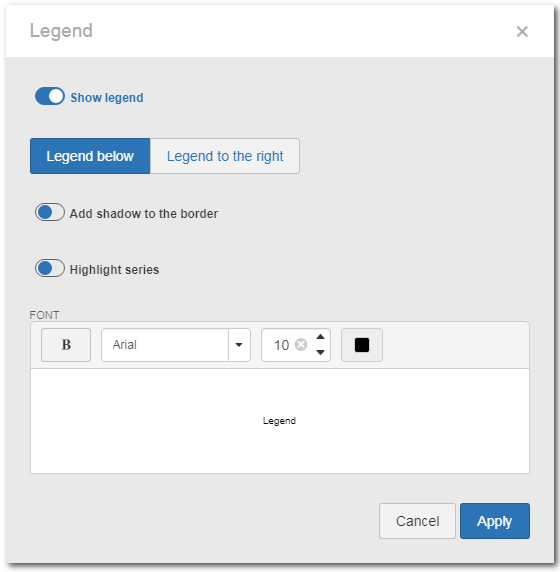
2.At this point, the screen for legend configuration will open. After enabling the Show legend option, the following fields will be available:
Legend below/Legend to the right: Select the option corresponding to the location where the chart legend will be displayed. By default, the system displays the legend below the chart. Add shadow to the border: Enable this option for the legend to have a shaded border around itself. If this option is not enabled, the shaded border will not be displayed. Highlight series: Enable this option so that by hovering over one of the legends, in the legend repository, the information pertaining to it is highlighted in the chart. Font: Use the options in this field to perform the desired formatting in the text of the legend. At the bottom of this field, it is possible to view how the legend text will be displayed.
3.After making the necessary configurations, click on the Apply button at the bottom of the screen. Use the Cancel button, or the "Close" option on the top corner of the screen, to get out of it without saving the changes performed. |