Configuring chart details |
|
|
Here's how to configure the chart details:
1.In the Display palette of the toolbar, click on the Details option.
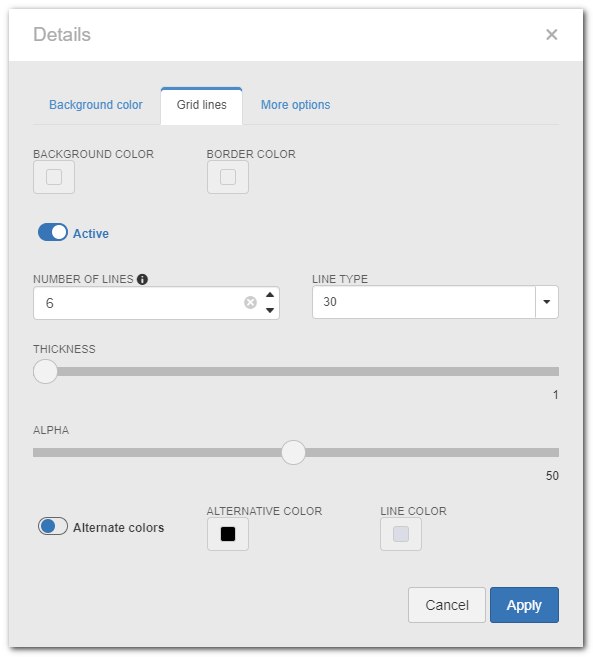
2.At this point, the chart details screen will be displayed:
3.Perform the necessary configurations in the following tabs:
Background colorIn this tab, it is possible to add and configure ranges that will shade the background of the chart. To do that, the following fields are available: Name: Enter a name for the range that will shade the chart. The name will be displayed next to the range, in the chart. Color: Select the range colors that will shade the chart. Start value: Enter a Y-axis value from which the range will start. End value: Enter a Y-axis value in which the range will end.
Grid linesIn this tab, it is possible to configure whether grid lines are displayed in the background of the chart or not. To do that, the following fields are available: Background color: Select the background color of the chart. Border color: Select the border color of the chart. Asset: Enable this option and fill out the following fields: ▪Number of lines: Enter the number of grid lines that the chart will have. This field will be disabled if there is a scale range defined in the axis configurations ("Y-axis on the left" or "Y-axis on the right" tab). ▪Line type: Select the type that will be applied to the grid lines of the chart. ▪Thickness: Drag the slider button on this field until the grid line reaches the desired thickness. ▪Alpha: Drag the slider button on this field until the grid line reaches the desired transparency. ▪Alternate between colors: Enable this option so that grid lines have different colors interspersed. In the fields next to this option, select the desired colors.
More optionsIn this tab, enable the Display borders outline field for a border to be applied to each column of the chart.
4.After making the necessary configurations, click on the Apply button at the bottom of the screen. Use the Cancel button, or the "Close" option on the top corner of the screen, to get out of it without saving the changes performed. |