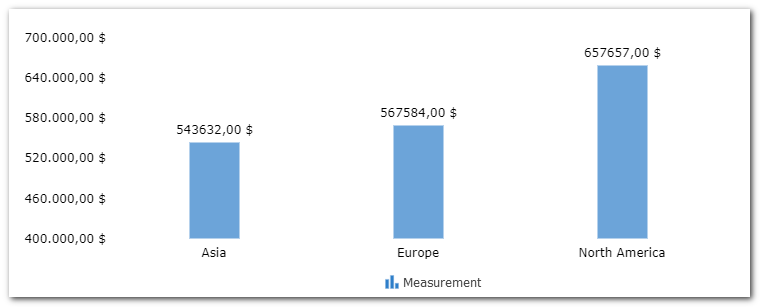
New graphic analysis type: Comparative Analysis
A new chart type has been made available, in which it is possible to compare, side by side, the target and measurement values and its cumulative values from several indicators.

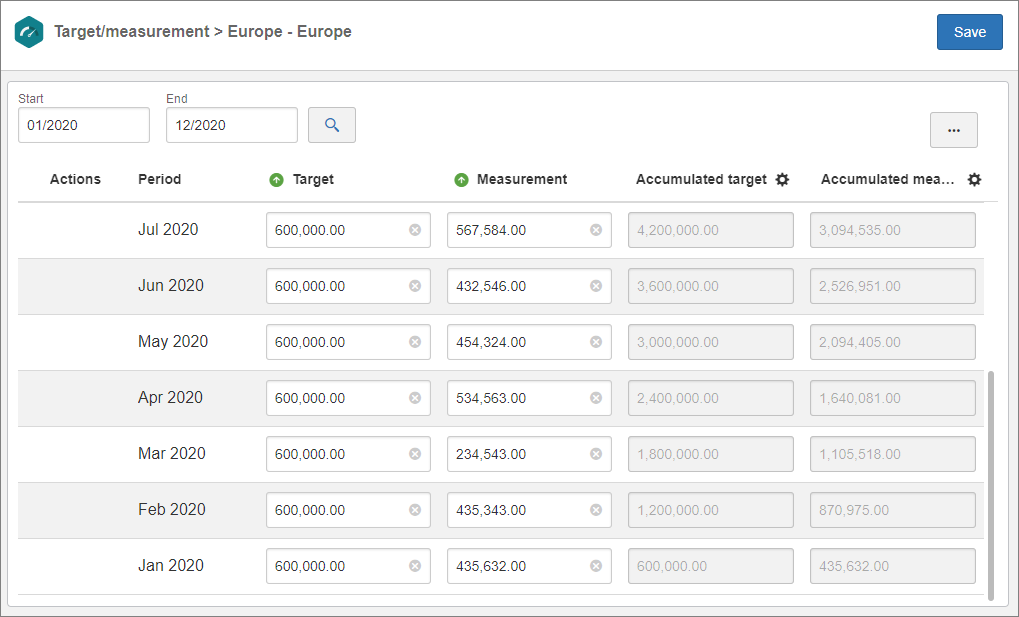
New target/measurement input screen
The target and measurement input screen has been reformulated, and it will no longer be necessary to add the periods before entering the values of the indicator periods. It is also possible to replicate the values between the columns, "pulling" the value up or down.

Formulas for accumulated additional field
It is now possible to define formulas for the accumulated values of the additional fields of the indicators.
Use values of the indicator series in the accumulated values
From this version onwards, it is possible to use the same value of the target in the accumulated target formulas and of the measurement in the accumulated measurement formulas.
Previous versions
View also the improvements made to this component in previous versions:
