|
The SE Analytics vision editor allows handling and analyzing a large volume of data under multiple perspectives, allowing managers to analyze data in a comparative way, which will facilitate their daily decision-making process.
Visions can be generated through the third quadrant in the File  Analysis panel menu if the logged user has permission to perform this operation, as well as through a search conducted in another SE Suite component. Analysis panel menu if the logged user has permission to perform this operation, as well as through a search conducted in another SE Suite component.
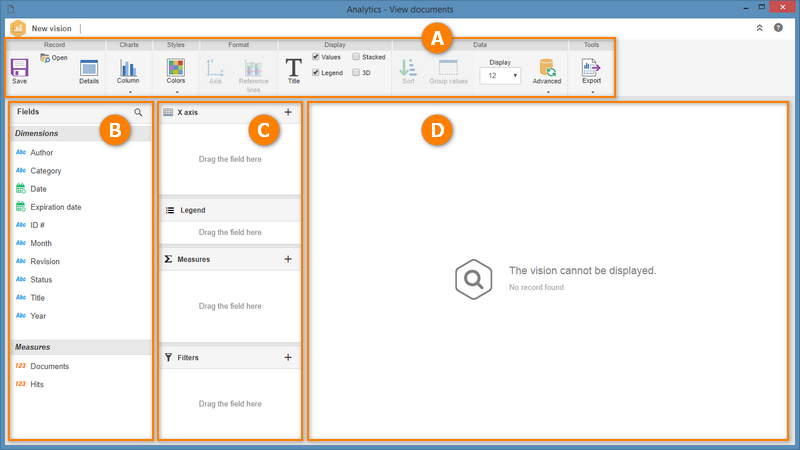
When accessing the vision editor, it is displayed according to the image below. The alphabetical letters identify each available item:
A
|
The Toolbar displays the buttons that allow defining the chart, formatting and configuring how the analysis information will be displayed.
|
B
|
The Fields panel displays the dimensions and measurements whose values may be dragged to the analysis areas. It is important to point out that the possible fields available come from the query configured in the analysis record, for analysis visions, or from the fields available in the view, for system menu visions.
The dimensions are the different perspectives involved in the analyses. Dimensions usually correspond to non-numeric fields in a data warehouse and provide descriptive information. For example: Country, Name, Region, among others.
The measurements provide quantitative information that you wish to view and analyze, that is, they are numeric fields in a database. For example: invoice value, percentage of sales, among others.
|
C
|
This panel displays areas or sections in which the dimensions and measurements fields must be associated in order for the results to be displayed in the analysis area. Some of these areas vary according to the chart type defined by the vision.
Moreover, it is possible to drag data to the filters area and restrict the analysis result even further, as well as to generate series for the displayed information through the caption field.
|
D
|
This area displays the analysis result. This result may later be shared as a vision in a portal.
|
E
|
This panel will only be displayed if the "Enable panel for the configuration of visual styles and properties" option is checked in the general parameters.
|
Main operations
▪Creating a vision ▪Defining the vision chart
Related links
▪Using visions in portals ▪SE Suite object links
|