Creating a vision |
|
|
In the File
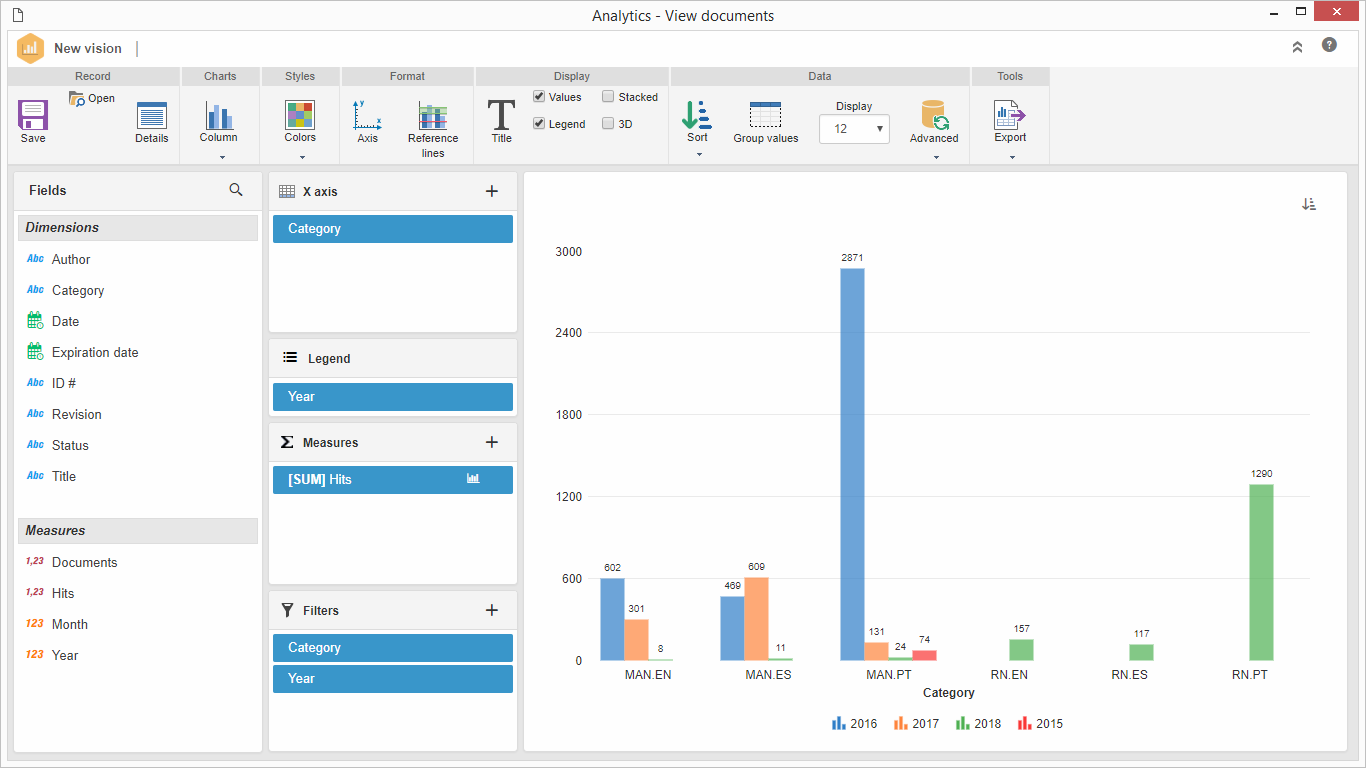
By accessing one of the previously described options, the vision editor screen will be displayed. Perform the following steps:
1.Click on the arrow below the Charts option on the vision editor toolbar and select the option that corresponds to how you wish the vision data to be displayed. 2.Drag the fields(2) for dimensions and measurements that will compose the vision to the desired areas(3): ▪It is possible to configure how the dimension and measurements field will be displayed. To do that, simply click on the field that was dragged to the analysis and fill out the necessary fields. ▪If it is necessary to filter the data displayed on the vision, drag the fields you wish to use as a filter to the corresponding area. ▪For each area (dimension, measurement, and filters), it is possible to configure a calculated field. To do this, click on the 3.Once done, click on the UPDATE button displayed on the vision area for the configurations to be applied. 4.After performing all desired adjustments, save the vision. On the screen that will be opened, enter a name for the vision and save.
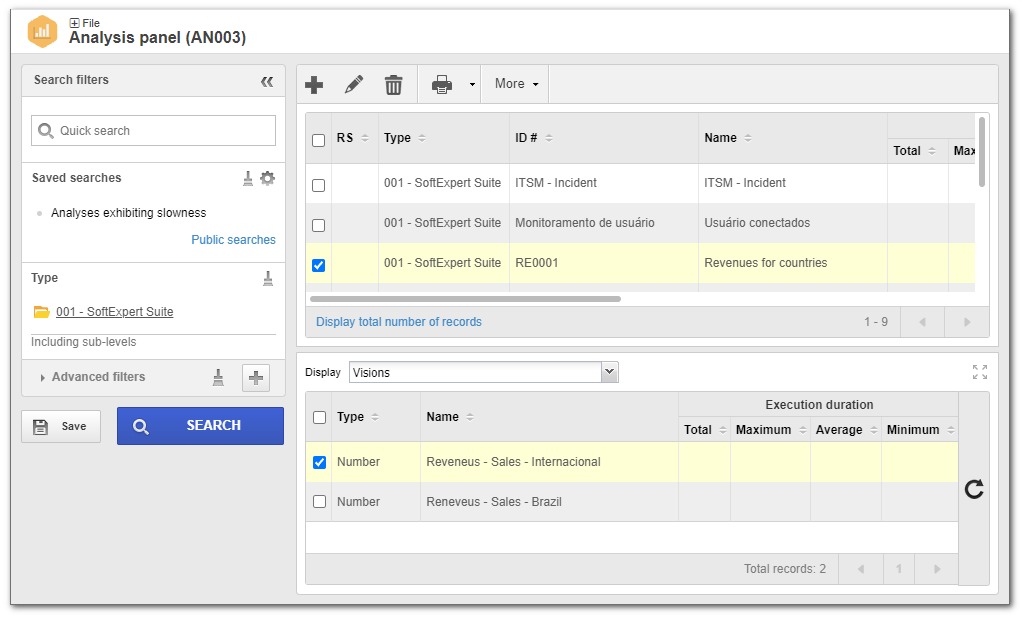
If you are editing the vision, it will already be configured. In this case, simply perform the necessary adjustments. When editing an analysis, a message may be displayed to inform that the analysis is displaying slowness. In this case, in the analysis data, access the "Construct query" step and revise the SQL and/or activate the materialization.
Related links
|