Creating a vision from other components |
|
|
To create a vision through the search menu of other SoftExpert Suite components, follow the steps below:
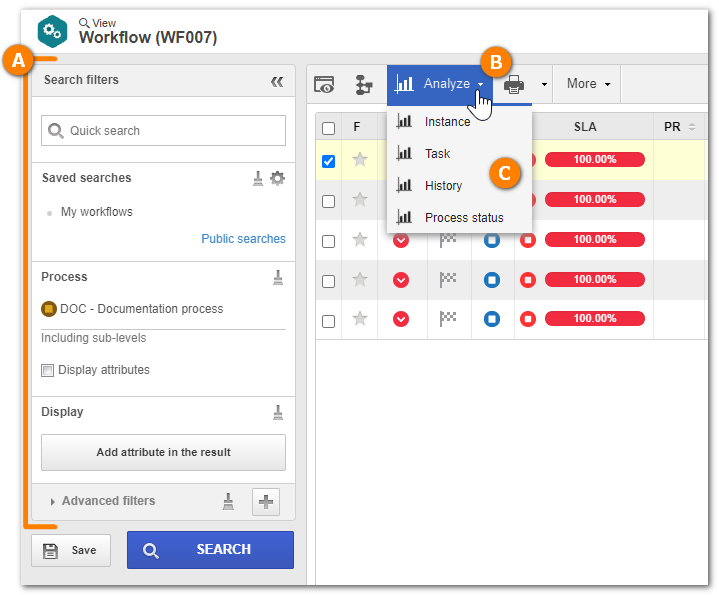
After filtering and locating the desired records(1) (A), click on the arrow next to the Analyze (B) button on the toolbar and select the desired option (C).
At this point, the vision editor screen will be displayed. Perform the following steps:
1.Click on the arrow below the Charts option on the vision editor toolbar and select the option that corresponds to how you wish the vision data to be displayed.
2.Drag the fields(2) for dimensions and measurements that will compose the vision to the desired areas(3): ▪It is possible to configure how the dimension and measurements field will be displayed. To do that, simply click on the field that was dragged to the analysis and fill out the necessary fields. ▪If it is necessary to filter the data displayed on the vision, drag the fields you wish to use as a filter to the corresponding area. ▪For each area (dimension, measurement, and filters), it is possible to configure a calculated field. To do this, click on the
3.Once done, click on the UPDATE button displayed on the vision area for the configurations to be applied.
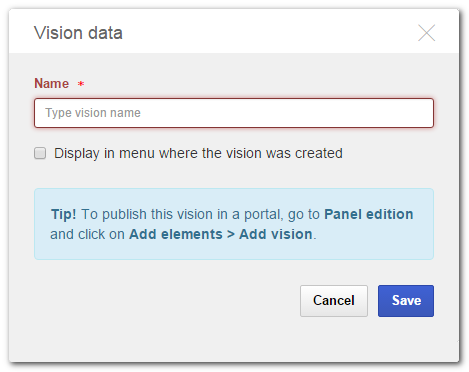
4.After performing all desired adjustments, save the vision for it to be accessed again or used in a portal. At this point, the system will request the user to enter a name and, if desired, to check the "Display in the menu where the vision was created" option, so that the vision is available as an option for the
Click on the Apply button to save the vision. If you wish to use the created vision in a portal, add it according to the description in the "Using visions in portals" topic of the "User guide" document.
Related links▪Defining the vision/OLAP chart |