Assembling a diagram


Assembling a diagram |


|
|
To assemble the Ishikawa diagram grouped by cause type and the Ishikawa diagram grouped by cause, click on the
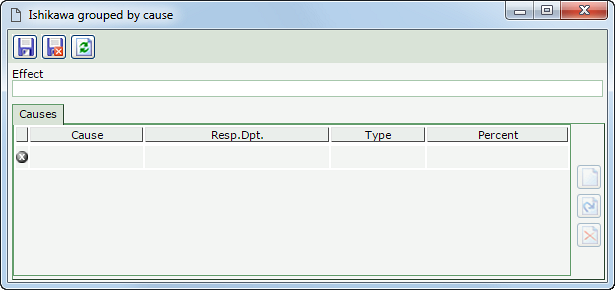
On the screen that will open, select, in the respective field, the effect, that is, the problem to be analyzed.
 This image refers to an effect in an Ishikawa diagram grouped by cause type. However, the screen displayed for the "Ishikawa diagram grouped by cause" and the "5 Whys diagram" is similar.
Save the record. At this point, the following tab will be enabled:
After identifying all effect causes, save the record. Causes associated with the analysis tools will be displayed in the list of records "Cause", on the cause analysis data screen, whereas the proposed actions will be displayed in the list of records "Action" on the planning data screen of the action plan actions.
When assembling an Ishikawa diagram, the system allows the creation of several levels for the causes being identified, i.e., the detailing of the causes of another cause. While the team carries out this process, it is necessary to, repeatedly, ask the following question: "What were the causes that probably caused this effect?". To add a new branch (level), first select one of the causes of the Ishikawa diagram, represented by the light-green rectangles. On the data screen that will open up, the Effect field will be displayed automatically filled in with the name of the selected cause. Use the Cause tab to associate the causes of the effect. Once done, save the record. On the main screen, select the cause in which the branch was created again, and click on the |