|
This tab makes available the options to manipulate or even add other projects to the structure of the project in question, divided in the following sections:
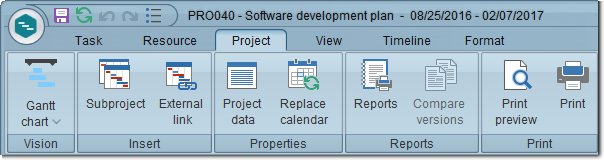
Vision - In this section, the system will make available for use the visions configured in the view profile associated with the project, the network diagram, and the resource usage. To switch between these options, click on the arrow located below the vision and select the desired option:
|
Gantt Chart
|
This vision is only displayed if the view profile associated with the project is the pre-configured profile of the system. It consists of a table containing the information pertaining to the project and its tasks and a bar chart on a timescale, which displays the duration and dependence between the tasks, enabling the performance of a better comparison between the planned and rescheduled data of the project tasks.
|
Tracking chart
|
This vision is only displayed if the view profile associated with the project is the pre-configured profile of the system. It consists of a table containing the information pertaining to the project and its tasks and a bar chart on a timescale, in addition to displaying the duration and dependence between the tasks, enabling the performance of a better comparison between the rescheduled and actual data of project tasks.
|
Detailed chart
|
This vision is only displayed if the view profile associated with the project is the pre-configured profile of the system. It consists of a table containing the information pertaining to the project and its tasks and a bar chart on a timescale, in addition to displaying the duration and dependence between tasks, enabling a detailed overview of all information of the tasks that compose the structure of the project.
|
Resources
|
This vision presents a table with all the allocated resources involved in the project, with the tasks to which they are allocated grouped below each one of them. It also displays the hours allocated to each task and the total hours allocated to each resource. In the calendar area, it is possible to graphically view the percentage of hours allocated for each resource, being:
▪Blue: 100% allocated ▪Green: Allocated ▪Red: Over-allocated |
Network diagram
|
This vision displays all the project tasks and their dependencies through boxes that make up an organizational whole and are displayed in the format of a network.
|
▪The chart area, critical path, comparison with the actual, and the current date row will be displayed when accessing SE GanttChart, according to the definitions set in the Parameter tab of the vision data. ▪It is possible to hide/display the columns displayed in the table area, to customize the vision, so that only relevant information for the user is displayed. |
Add
|
Subproject
|
Click on this button to add a subproject to the structure of the project in question. See more details in the Adding a subproject section.
|
External link
|
Click on this button to create a link between a task of the project in question with a task of another project. See further details in the Adding an external link section.
|
Properties
|
Project data
|
Click on this button to view the data of the project whose SE GanttChart is being edited. Refer to the Editing a planning project section for a detailed description on the project data screen.
|
Replace calendar
|
Click on this button to replace the calendar used by the project with another calendar. On the screen that will be displayed, select the calendar that will be applied to the project. The calendars saved in the SE Administration component will be available for selection. After that, the system will issue an alert referring to the recalculation of the projects based on the new calendar. Confirm the change for the calendar to be effectively replaced and the recalculation performed.
|
Reports
|
Reports
|
Click on this button to generate the project task report or other available options. See further details in the Generating a project report section.
|
Compare versions
|
This button will not be available if the project has Planning status. Click on it to generate, in the chart area, a comparison between the project values (planned x actual, planned x rescheduled etc.). On the screen that will be displayed, define how the comparison will be made. Note that the comparison of the project revision is always done based on the rescheduled data and the option chosen: planned, actual or revisions (none). After clicking on OK, the comparative GanttChart will be displayed.
|
Print
|
Print preview
|
Click on this button to view how the GanttChart will be printed and to perform the necessary adjustments. See further details in the Project print preview section.
|
Print
|
Click on this button to effectively print the project GanttChart. On the screen that will be displayed, it is possible to define the printer, the pages that will be printed, the number of copies, and other desired properties.
|
|