|
This vision allows viewing the scorecard and the elements and indicators that compose it in a hierarchical way. To access it, click on the Vision  Analysis diagram option. Analysis diagram option.
The vision is divided according to the following image. The alphabetical letters identify each available item:
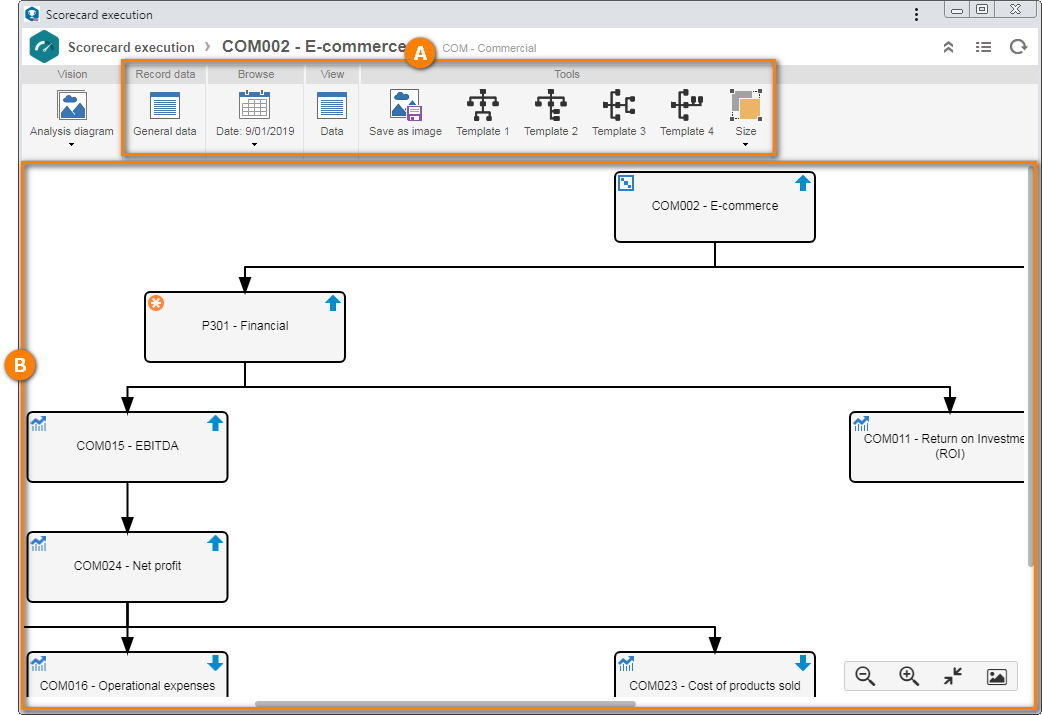
A
|
The Toolbar displays the buttons that allow manipulating the analysis diagram. See the description of each button in the Toolbar section below.
|
B
|
The lower part of the screen displays the scorecard hierarchy, allowing its analysis. Hover the mouse over the items of the analysis diagram to identify them. Use the buttons in the suspended panel to reduce or zoom in on the analysis diagram, adjust the screen size, or save it as an image.
|
Toolbar
Record data
|
General data
|
Click on this button to view the details of the scorecard/element/indicator selected in the diagram. Note that if the selected item does not have values added, the screen will not open. See more details in the General data section.
|
Browse
|
Date
|
Click on the arrow located below this button and select the date that corresponds to the period you wish to view.
|
Tools
|
Save as image
|
Click on this button to export the analysis diagram to a .png file.
|
Template 1
|
Click on one of these options to define how the analysis diagram will be displayed.
|
Template 2
|
Template 3
|
Template 4
|
Size
|
Click on the arrow located below this option and select the corresponding alternative to change the size of the items in the diagram. If the "Customized" option is selected, you can set the width, height, distance in width, and distance in height of the diagram items.
|
The availability of the buttons will depend on the permissions granted in the security of the scorecard.
|
|
|