See a quick and easy way of analyzing a scorecard in the "Analyze a scorecard" topic of the SE Performance Quick Guide!
|
To add a new graph analysis, click on the  button on the main screen toolbar. On the screen that will be displayed, select the type to classify the graph analysis and save your selection. button on the main screen toolbar. On the screen that will be displayed, select the type to classify the graph analysis and save your selection.
To edit the data of a graph analysis, select it in the list of records and click on the  button. button.
On the screen that will be opened, enter an ID # and a name for the graph analysis. The following tabs are also available:
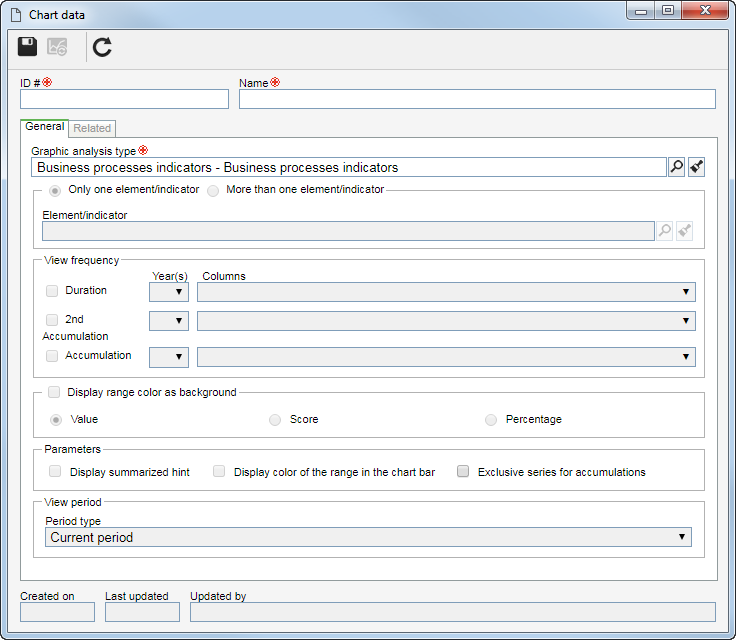
Note: After saving the record, the fields in the General tab will be available to be filled out. The Related tab will only be available after the graph analysis is associated with a record.
Graph analysis type
|
Displays the type selected during the addition, although it is possible to edit it. In this case, select the type that will classify the graph analysis.
|
Select one of the following options to define the number of elements/indicators that will be graphically analyzed:
|
Element/Indicator
|
Select the element/indicator that will be analyzed. If the selected element/indicator has lower level records in the scorecard structure, these lower level records will not be considered in the chart.
|
View frequency
|
Period
|
The options available to be checked will vary depending on the frequency of the indicator/element and the frequency of the accumulation and the second accumulation (if an indicator was previously selected).
Keep the options that correspond to the frequencies you do not wish to view in the chart unchecked.
Check the options that correspond to the frequencies you wish to view in the chart.
|
2nd Accumulation
|
Accumulation
|
Years
|
Define how many previous periods will be considered in the chart. For example: If it is entered 1, it will be considered the current year. If it is selected 2, it will be considered the current year and the last year.
|
Columns
|
Expand the list and check the options corresponding to the element/indicator information you wish to view in the chart. Keep the ones you do not wish to view unchecked.
|
|
Checked
|
Unchecked
|
Display range color as background1
|
The ranges that compose the chart will be displayed in different colors in the chart background. The colors displayed in the chart range are those configured in the items of the range associated with the indicator. Select one of the available options to set the value that will delimit the range area.
|
The range colors will not be displayed in the chart background.
|
1 - This option will only be available if the accumulation frequency has not been checked in the "View frequency" field.
Parameters
|
Checked
|
Unchecked
|
Display summarized hint
|
When hovering the mouse over the chart bars, only the value and the period will be displayed.
|
The hint will display the series name, the value, the period and the range configuration.
|
Display color of the range in the chart bar
|
The chart bars will be displayed with the colors of the ranges that classify the values they represent.
|
The bars will be displayed with the colors set in the chart configuration.
|
Exclusive series for accumulations
|
Applies a different format to the accumulated and period values.
|
The accumulation values will be displayed in the same data series as the period values, with the same format in the chart.
|
View period
|
Viewing type
|
Select which period of the element/indicator will be viewed. If the Number of periods for analysis option is selected, enter the number of periods prior to the current period desired in the field that will be enabled.
|
|
On the side toolbar, the following buttons will be available:
|
Click on this button to associate an element or indicator with the graph analysis. On the screen that will be opened, select the desired element/indicator in the respective field. In the Column field, select the option that corresponds to the information of the element/indicator you wish to view in the chart. You can associate the same element/indicator more than once, but with different information (column) to be displayed in the chart.
|
|
Click on this button to edit the association with the graph analysis of the element/indicator selected in the list of records.
|

|
Click on this button to disassociate the element/indicator selected in the list of records from the graph analysis.
|
|
|
In this tab, the indicators and portal widgets that use the graph analysis in question will be listed, divided into tabs. The graph analyses that have association can be identified by the "A" (Associated?) column, in the list of records of the second quadrant.
|
After setting all the necessary configurations, save the record.
After you add the analysis and set the data that you make it up, it is necessary to configure the chart that will represent it. To do that, select the desired graph analysis from the second quadrant on the main screen and then click on the  button. For further details about the chart configuration resource, refer to the Chart configuration section. Once done, the graph analysis will be displayed in the third quadrant of the main screen. button. For further details about the chart configuration resource, refer to the Chart configuration section. Once done, the graph analysis will be displayed in the third quadrant of the main screen.
|
|