Navigation:  Management > Graph analysis >

Configuring a comparative analysis

Previous  Top  Next

The comparative analysis is available only for indicators with monthly frequency and yearly accumulation. To add it, click on the new button on the main toolbar. On the screen that will be displayed, select the type to classify the comparative analysis and save your selection.


To edit the data of a comparative analysis, select it in the list of records and click on the edit button.


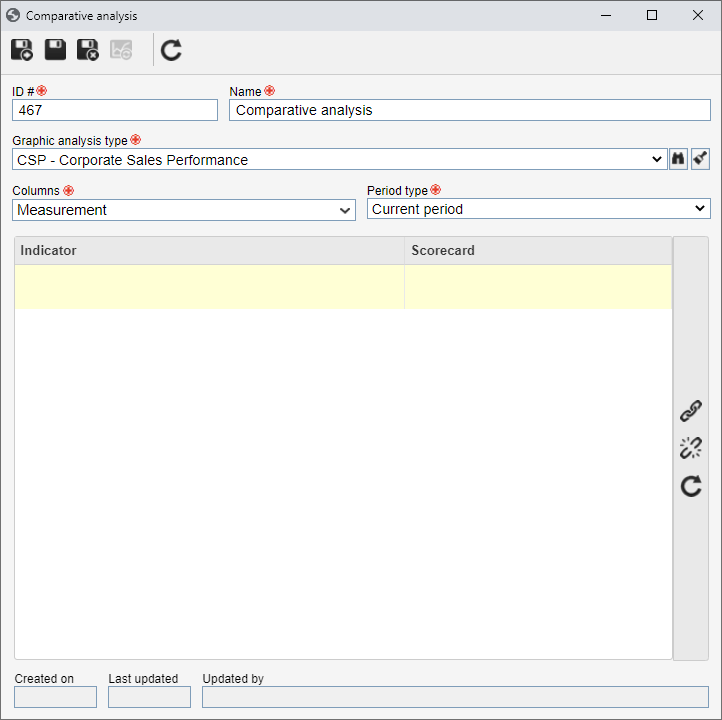
On the screen that will be opened, enter an ID # and a name, define which columns will be displayed, and select the period the comparative analysis will cover.


analise_comparativa


On the side toolbar, the following buttons will be available:


link

Click on this button to associate indicators with the comparative analysis. On the screen that will be opened, use the Scorecard or Indicator tabs to select the desired indicators.

unlink

Click on this button to disassociate the indicators selected in the list of records from the comparative analysis.


After setting all the necessary configurations, save the record.


In the portals, the comparative analysis will be listed with the graph analyses in the Graph analysis widget.