|
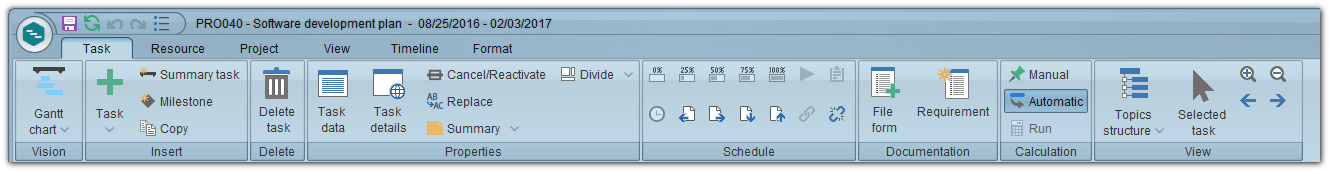
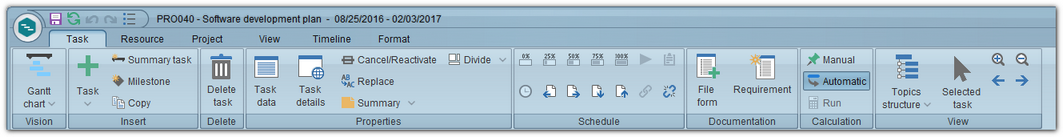
In this tab, several buttons and menus are available for the manipulation of project tasks, divided in the following sections:
Vision - In this section, the system will make available for use the visions configured in the view profile associated with the project, the network diagram, and the resource usage. To switch between these options, click on the arrow located below the vision and select the desired option:
|
Gantt Chart
|
This vision is only displayed if the view profile associated with the project is the pre-configured profile of the system. It consists of a table containing the information pertaining to the project and its tasks and a bar chart on a timescale, which displays the duration and dependence between the tasks, enabling the performance of a better comparison between the planned and rescheduled data of the project tasks.
|
Tracking chart
|
This vision is only displayed if the view profile associated with the project is the pre-configured profile of the system. It consists of a table containing the information pertaining to the project and its tasks and a bar chart on a timescale, in addition to displaying the duration and dependence between the tasks, enabling the performance of a better comparison between the rescheduled and actual data of project tasks.
|
Detailed chart
|
This vision is only displayed if the view profile associated with the project is the pre-configured profile of the system. It consists of a table containing the information pertaining to the project and its tasks and a bar chart on a timescale, in addition to displaying the duration and dependence between tasks, enabling a detailed overview of all information of the tasks that compose the structure of the project.
|
Resources
|
This vision presents a table with all the allocated resources involved in the project, with the tasks to which they are allocated grouped below each one of them. It also displays the hours allocated to each task and the total hours allocated to each resource. In the calendar area, it is possible to graphically view the percentage of hours allocated for each resource, being:
▪Blue: 100% allocated ▪Green: Allocated ▪Red: Over-allocated |
Network diagram
|
This vision displays all the project tasks and their dependencies through boxes that make up an organizational whole and are displayed in the format of a network.
|
▪The chart area, critical path, comparison with the actual, and the current date row will be displayed when accessing SE GanttChart, according to the definitions set in the Parameter tab of the vision data. ▪It is possible to hide/display the columns displayed in the table area, to customize the vision, so that only relevant information for the user is displayed. |
Add
|
Task
|
Click on the arrow located under this option to add a new task or a new recurring task.
|
Summary task
|
Click on this button to add a new summary task, i.e., a task that encompasses other tasks. See more details in the Adding a task section.
|
Milestone
|
Click on this button to delete a milestone, i.e., a landmark in the project structure. See more details in the Adding a task section.
|
Copy
|
Click on this button to copy tasks either from the project itself, from a template, or from other projects to the structure of the project in question. See more details in the Copying a task section.
|
Delete
|
Delete task
|
Click on this button to delete a task or unlink a subproject from the master project. To do that, select the desired record in the project structure. For the task to be definitely deleted, confirm the action being taken. Use the CTRL or SHIFT keys on the keyboard to select more than one record in the project structure. This operation may also be performed by using the "Delete" key on the keyboard or through the shortcut displayed when double-clicking a record. Note that, when selecting a subproject, it will only be unlinked from the master project and not deleted from the system.
|
Properties
|
Task data
|
Click on this button to edit/view the data of the task selected in the project structure. See further details in the Editing task data section.
|
Task details
|
Click on this button to configure the details of the task selected in the project structure. See further details in the Configuring the task details section.
|
Cancel/Reactivate
|
Click on this button to cancel or reactivate the execution of the task selected in the project structure. See more details in the Cancelling/Reactivating a task section.
|
Replace
|
Click on this button to replace the data of the task selected in the project structure. See more details in the Replacing task information simultaneously section.
|
Summary
|
Click on this button to edit the information of the summary task selected in the project structure. See further details in the Editing task summary section.
|
Divide
|
Click on this button to add one more quadrant to the SE GanttChart vision, in which the task data selected in the structure will be displayed. The disposition of the additional quadrant may be: Lower or Right. Use the Remove option to delete the additional quadrant.
|
Schedule
|
0% finished
|
Click on this button to assign the value of the Actual % as 0%, thus undoing the execution of the selected task. Note that this operation will delete all actual information of the task. Confirm the selection made by the system to effectively undo the execution of the task. Use the CTRL or SHIFT key on the keyboard to select more than one task at a time and undo their execution simultaneously.
|
25% finished
|
Click on this button to assign the value of the Actual % as 25%. If the execution of the task is being started, its actual start date will be filled in by the system with the current date. Use the CTRL or SHIFT key on the keyboard to select more than one task at a time and execute them simultaneously. After starting the execution of a task, access its data screen through the Task execution menu and fill out the necessary fields. Refer to the Editing task in progress option for a detailed description of the fields that must be filled in.
|
50% finished
|
Click on this button to assign the value to the Actual % as 50%. If the execution of the task is being started, its actual start date will be filled in by the system with the current date. Use the CTRL or SHIFT key on the keyboard to select more than one task at a time and execute them simultaneously. After starting the execution of a task, access its data screen through the Task execution menu and fill out the necessary fields. Refer to the Editing task in progress option for a detailed description of the fields that must be filled in.
|
75% finished
|
Click on this button to assign the value to the Actual % as 75%. If the execution of the task is being started, its actual start date will be filled in by the system with the current date. Use the CTRL or SHIFT key on the keyboard to select more than one task at a time and execute them simultaneously. After starting the execution of a task, access its data screen through the Task execution menu and fill out the necessary fields. Refer to the Editing task in progress option for a detailed description of the fields that must be filled in.
|
100% finished
|
Click on this button to assign the value of the Actual % as 100%. The actual end date of the task will be filled in by the system with the current date, thus closing the task. Before clicking on this button, all the required fields of the task (execution checklist, required forms, requirements, etc.) must be properly filled in. When a required field is not filled in, the system will issue an alert informing of the error. Refer to the Editing task in progress section for a detailed description of the fields and sections that may be available for completion during the task execution. Use the CTRL or SHIFT key on the keyboard to select more than one task at a time and finish their execution simultaneously.
|
Task execution
|
Click on this button to start or finish the execution of a task. If the task is being started, on the screen that displays, fill in the Start and Actual % fields. If the task is being finished, fill in the End or Actual % fields or use the Set actual duration as zero or Options for filling out option as needed. See the detailed description of these fields in the Executing a task section. Use the CTRL or SHIFT key on the keyboard to select more than one task at a time and execute them simultaneously.
|
Task verification
|
Click on this button to perform the task verification selected in the list of records. On the screen that will be displayed, enter whether the execution of the task will be accepted or not and enter the necessary comments. Note that this button will only be enabled if the selected task has the Task verification option checked on its data screen and if the logged-in user is responsible for it.
|
Timesheet
|
Click on this button to enter the time spent to execute the task. Note that this button is only enabled if the SE Time Control component is part of the solutions acquired by your organization, the "Allow entering time" option is selected on the project type or task type data screen, and if the logged-in user is allocated to the selected task. Refer to the specific SE Time Control for more details on timesheets.
|
Move task backwards
|
Click on this button to move the task selected in the structure left. When moving a task that is one level below the summary task left, for example, it will stop being a subtask and will be in the same level as the summary task. Use the CTRL and SHIFT keys on the keyboard to select more than one task at a time in the structure. This operation may also be performed through the shortcut displayed when right-clicking on the tasks you wish to move.
|
Move task forwards
|
Click on this button to move the task selected in the structure to the right. When moving a task to the right, it will become a subtask of the task that precedes it, i.e., the task before the task that was moved will become a summary task. Use the CTRL and SHIFT keys on the keyboard to select more than one task at a time in the structure. This operation may also be performed through the shortcut displayed when right-clicking on the tasks you wish to move.
|
Move task downwards
|
Click on this button to move the task selected in the project structure down. This operation may also be performed through the shortcut displayed when right-clicking on the tasks you wish to move.
|
Move task upwards
|
Click on this button to move the task selected in the project structure up. This operation may also be performed through the shortcut displayed when right-clicking on the tasks you wish to move.
|
Link tasks
|
Click on this button to create a dependency link between two or more tasks in the project structure. Use the CTRL and SHIFT keys on the keyboard to select more than one task at a time in the structure. If in the general parameters of SE Gantt Chart, the Show options when linking tasks option is checked, after clicking on this button, the system will display a screen which will allow entering the link type (predecessor) and the lag between the tasks. This operation may also be performed through the Predecessors tab of the task data screen, through the shortcut displayed when right-clicking on the selected tasks, or even through the Predecessors column in the project structure.
|
Unlink tasks
|
Click on this button to undo the dependency link of a task. Use the CTRL and SHIFT keys on the keyboard to select more than one task at a time in the structure. This operation may also be performed through the Predecessors tab of the task data screen, through the shortcut displayed when right-clicking on the selected tasks, or even through column Predecessors in the project structure.
|
Some of the buttons of the Schedule palette will be enabled according to the menu which SE GanttChart is being accessed through, such as:
▪Planning: The system will enable the buttons referring to indentation and link between tasks; ▪Execution: The system will enable the buttons referring to the task execution. Logged users, however, may only execute the tasks under their responsibility. ▪Tracking: The buttons will be enabled according to the role of the user logged-on the project: the logged users may verify the subtasks under their responsibility, enter time in tasks which they are allocated in, and perform the other operations mentioned above. |
Calculation
|
Manual
|
Click on this button for the project schedule not to be calculated automatically as the tasks are added and linked. When defining this option, the schedule calculation will only be performed when clicking on the "Execute" button. This option will be applied, by default, to the project tasks if the "Automatic calculation active as default" option of the general parameters is not checked.
|
Automatic
|
Click on this button so that, when linking the project tasks, they are calculated and displayed automatically in the Gantt chart according to the configurations set in their data. This option will be applied, by default, to the project tasks if the "Automatic calculation active as default" option of the general parameters is checked.
|
Execute
|
Click on this button when the project schedule calculation is set as Manual, so that the project tasks are calculated taking into consideration their links and other configurations performed in its data.
|
View
|
Topics structure
|
By clicking on the arrow located below this button, the following options regarding the display of the project structure will be displayed:
▪View: Select this option to expand the whole project structure. ▪Hide: Select this option to collapse the whole project structure. ▪Structure level: Select, among the displayed options, up to which level of the structure should be displayed expanded. Tasks in levels below the selected level will be displayed collapsed. |
Scroll to task
|
Click on this button to access, directly in the chart, the period of the task selected in the list of tasks.
|
Enlarge
|
Click on this button to enlarge the time scale of the chart, i.e., to view the duration period of the project tasks in a more detailed way. This operation may also be performed through the zoom slide control or through the "CTRL +" keyboard shortcut.
|
Reduce
|
Click on this button to reduce the time scale of the chart, i.e., to view the duration period of the project tasks in a broader way. This operation may also be performed through the zoom slide control or through the "CTRL -" keyboard shortcut.
|
Left
|
Click on the respective buttons to navigate left in the period displayed in the chart. This operation can also be performed via the scroll bar at the bottom of the chart or by clicking and holding the left mouse button over the chart area and moving it to the left.
|
Right
|
Click on the respective buttons to navigate right in the period displayed in the chart. This operation can also be performed via the scroll bar at the bottom of the chart or by clicking and holding the left mouse button over the chart area and moving it to the right.
|
|