|
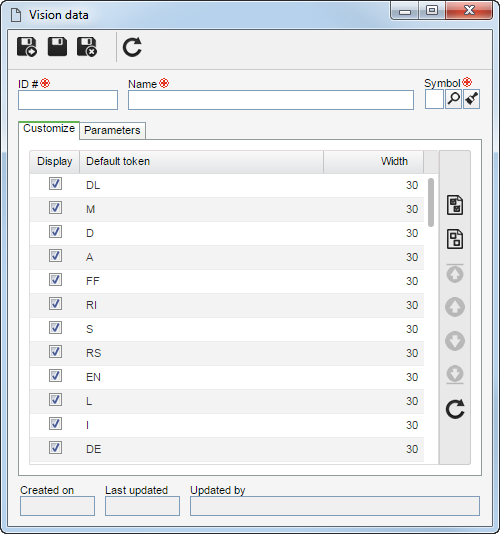
See how to configure a vision to be used in SE GanttChart, project schedule, program schedule or portfolio schedule:
Depending on the Object the view profile will be applied to, the options available for configuration on the vision data screen may vary. As the way to configure a vision for the three object types (project, program, and portfolio) is similar, the description will be made in this section only, identifying where they differ.
|
On the side toolbar, click on the  button. button.
Fill out the following fields on the data screen that will be displayed:

ID #: Enter a number or code to identify the vision.
Name: Enter a name to the vision.
Symbol: Select an image to represent the vision on the SE GanttChart toolbar, project schedule, program schedule, and portfolio schedule.
On the Customize tab, it is possible to configure the display of the columns in the SE GanttChart data screens, program schedule, program schedule and portfolio schedule:
Column
|
Display
|
Keep checked the field next to the columns that should be displayed. Uncheck the field next to the columns that should not be displayed.
|
Default token
|
The system will display the tokens used in the columns that may be displayed.
|
Width
|
By default, the displayed columns are 30 pixels wide. Click on the field in the row that corresponds to the column whose size you wish to change and enter, in pixels, the desired size for the column.
|
The order in which the columns will be displayed in the list of records equals the order in which they will be displayed on the SE GanttChart, project schedule, program schedule, and portfolio schedule data screens. As needed, use the following buttons on the side toolbar:

|
Click on this button to check all the displayed columns for them to be shown.
|

|
Click on this button to uncheck the display of all the displayed columns.
|

|
Click on this button to move a column to the top of the list of records. Select the desired record before clicking on the button.
|

|
Click on this button to change the order of the column selected in the list of records up.
|

|
Click on this button to change the order of the column selected in the list of records down.
|

|
Click on this button to move a column to the last position of the list of records. Select the desired record before clicking on the button.
|
|
|
Field
|
Status
|
Select the project/program status which, when accessing SE GanttChart or its schedules, the vision in question will be displayed with by default.
|
Gantt Chart
|
Set what will be displayed in the vision, when accessing SE GanttChart or its project/program/portfolio schedules:
▪Display Gantt chart: Check this option to make the Gantt chart area appear expanded. ▪Display critical path: This option will only be displayed if the view profile object is a project. Check this option for the critical path to be displayed in the Gantt chart area. It is important to point out that this option will only be applied to the project schedule if the critical path is duly calculated. ▪Display comparison with actual: Check this option for the planned x actual comparison to be displayed in the Gantt chart area. ▪Display current dateline: Check this option for the current date row to be displayed in the Gantt chart area. |
Left
|
Select the information that you wish to be displayed to the left of the task in SE GanttChart or the project/program/portfolio schedules.
|
Right
|
Select the information that you wish to be displayed to the right of the task in SE GanttChart or the project/program/portfolio schedules.
|
|
▪Add as many visions as desired. For that, just repeat the procedure described before. ▪If changes are made to the configurations of a vision, (for example, some columns are parameterized to no longer be displayed), they will be replicated to the projects/programs/portfolios of the type which the profile is associated with when a new project/program/portfolio is added or when restoring the visions. |
|


