Configuring the SE GanttChart general parameters |
|
|
See how to configure the available parameters:
1.Click on the General parameters option in the Format tab.
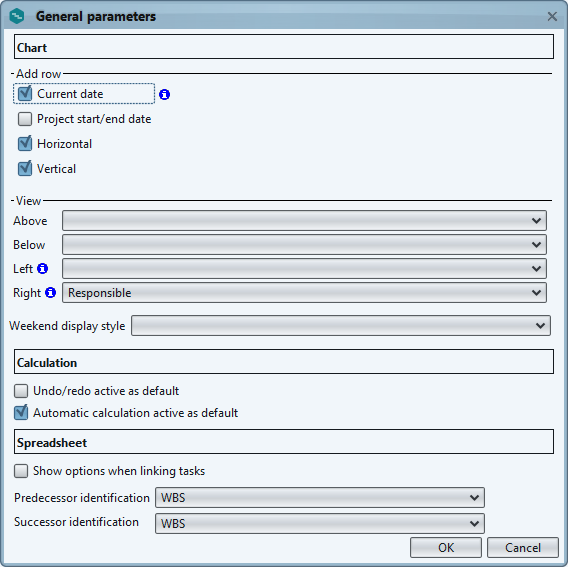
2.Fill in the following fields on the screen that will be displayed:
3.In the Chart section, it is possible to parameterize how some chart information will be displayed. The following options are available: Add row: Allows configuring the row type that will be displayed in the chart area: ▪Current date: Check this option for the system to display, in the SE GanttChart chart area, a vertical row showing the current date. ▪Project start/end date: Check this option for the system to display, in the SE GanttChart chart area, a blue vertical row showing the project start and end dates. ▪Horizontal: Check this option for the system to display, in the SE GanttChart chart area, horizontal rows delimiting the tasks space. ▪Vertical: Check this option for the system to display, in the SE GanttChart chart area, vertical rows delimiting the period space (columns). View: Allows configuring the view details of some information in the chart: ▪Above: Select the information that will be displayed above the bar that represents the task in the chart area. ▪Below: Select the information that will be displayed below the bar that represents the task in the chart area. ▪Left: This field is filled by the system with the information defined in the view profile associated with the project, but it is possible to edit it. In that case, select the information that will be displayed left of the bar that represents the task in the chart area. ▪Right: This field is filled by the system with the information defined in the view profile associated with the project, but it is possible to edit it. In that case, select the information that will be displayed right of the bar that represents the task in the chart area. ▪Weekend display style: Select the style that will be applied to weekends in the chart area.
4.in the Calculation section, the following options are available: Undo/redo active as default chart: Check this option for the "Undo" and "Redo" buttons on the basic operations toolbar to be displayed every time the Gantt chart in question is opened. In that case, after any change in the project, these buttons may be used. If this option is not checked, the "Undo" and "Redo" buttons will not be displayed in the basic operations bar. Automatic calculation active as default: Check this option so that when you add and assemble the project structure, the schedule calculation is set to automatic by the system. If this option is not selected, the schedule calculation will be manual by default. The calculation of the project schedule may be edited through the buttons of the Task tab.
5.In the Spreadsheet section, it is possible to parameterize some information of the task table that will be displayed. The following options are available: Show options when linking tasks: Check this field so that, when you establish a dependency between tasks through the Link tasks button of the Task tab, a screen is displayed to inform the link type (predecessor) and the lag between the tasks that are being linked. Predecessor identification: Select how the predecessor tasks of another task will be identified in the Predecessor column in the GanttChart table area: by its ID # or WBS. Successor identification: Select how the predecessor tasks of another task will be identified in the Successor column in the GanttChart table area: by its id # or WBS.
6.After setting all the necessary parameterizations, click on the OK option at the button of the screen. |