5 Whys |
|
|
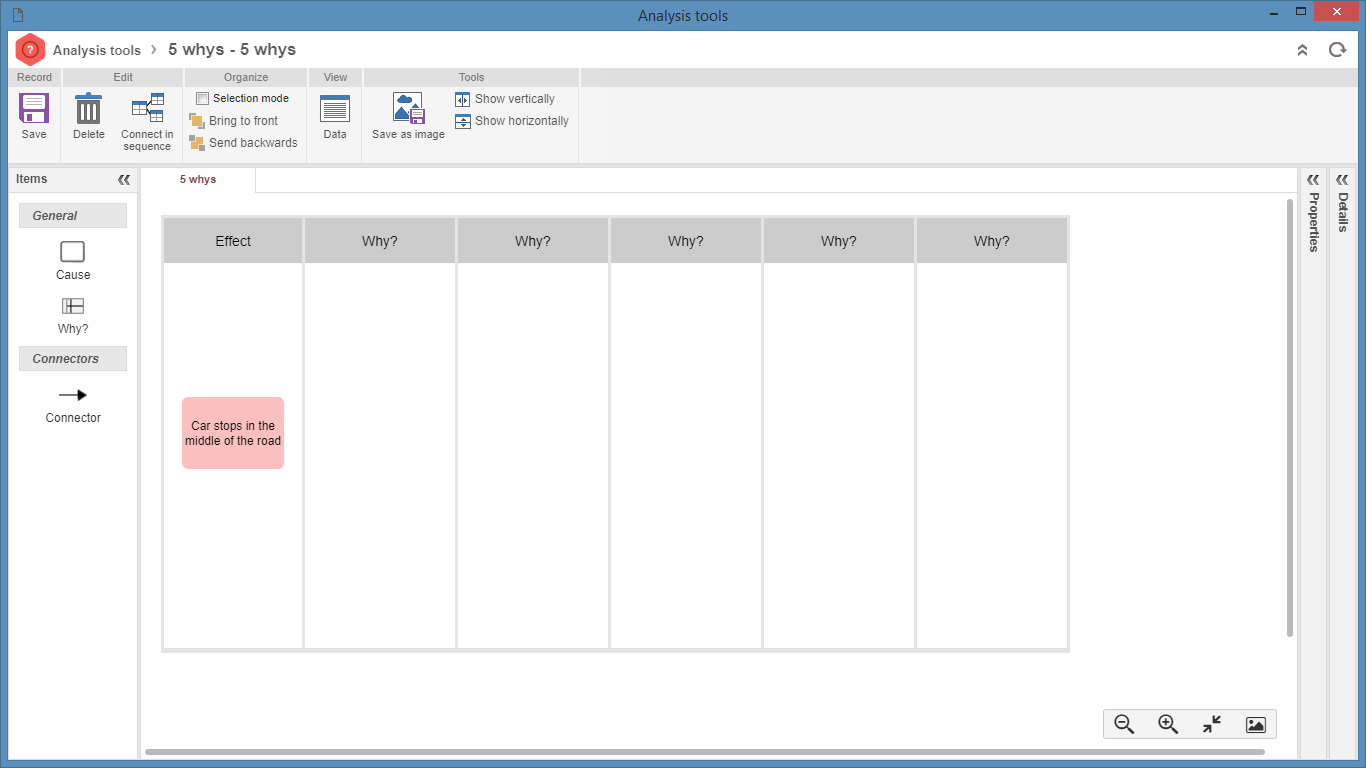
When selecting the "5 Whys" tool option, the following screen will be displayed:
In the diagram area, on the lane called Effect, the defect/problem to be analyzed will be displayed, while in the other lanes the questions must be entered (Why?). To define the questions and the effect, select the desired lane and on the Details panel, located on the right side, enter the title for it. Repeat this procedure until all the necessary questions and effect to find the cause of the analysis have been entered. If you need to add further questions, drag the Why? item of items panel, to the analysis modeling area.
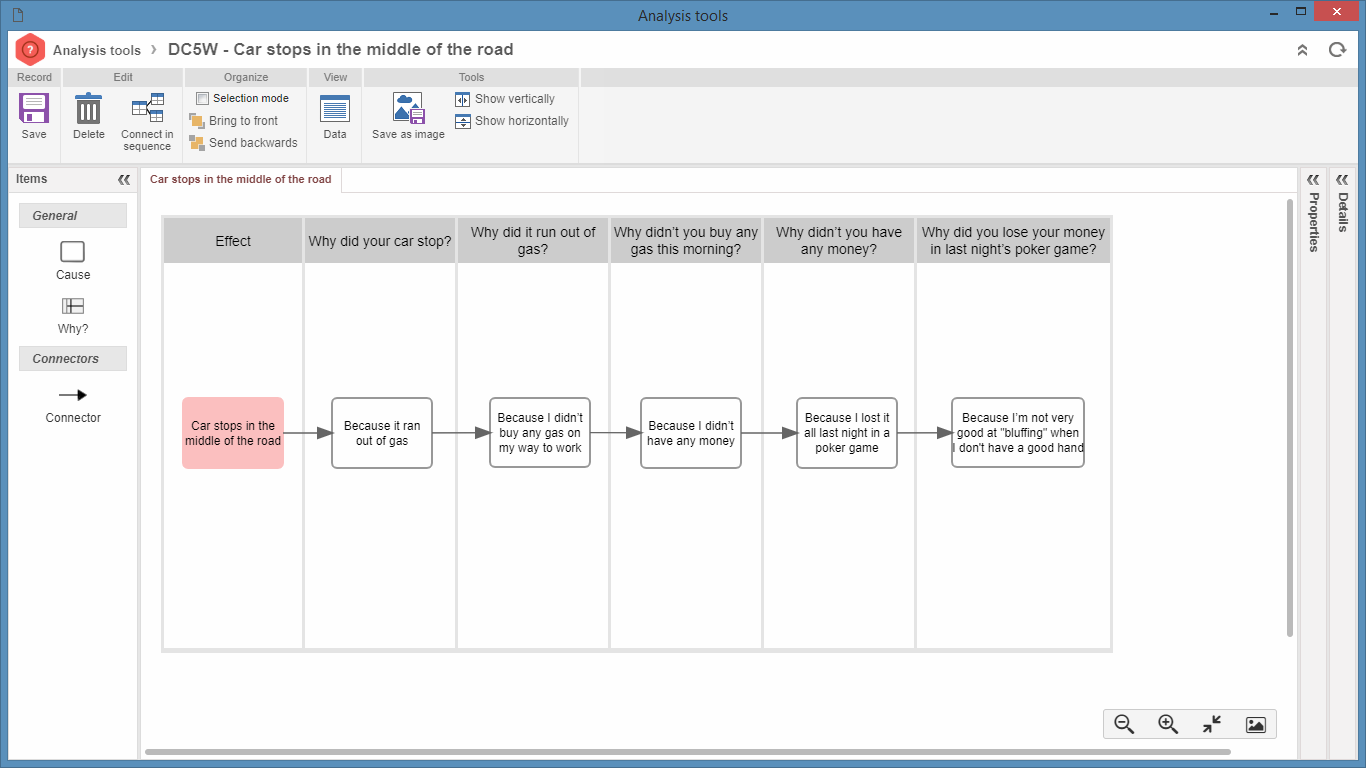
Drag the Cause item to enter the causes that will answer the question in each lane. Next, with the selected cause item, fill out the following fields in the Details panel, located on the right side of the screen:
▪Cause: Enter the defect cause. In this field it is possible to associate an existing cause or to record a new cause. Use the options located below this field to define if this particular cause is a Root cause or a Potential cause of the defect/problem. ▪Percentage: Enter the percentage to show how likely it is that this cause has generated the defect/problem under analysis. ▪Responsible department: Enter the responsible department for the cause. ▪Description: Enter a description for the cause.
Use the Connectors item to interconnect the defect with the causes. To do that, after the user clicks on the connector, the mouse cursor will change to an arrow. Click on the first element and then on the second. An arrow will connect the two items. Repeat the procedure every time it is necessary, to connect all the analysis elements.
Use the Properties panel, located on the right side of the screen, for advanced configurations (background color, border color, width, font color, alignment, shape, and others) in the items of the diagram that is being modeled. Use the Data button, located on the toolbar, to change the analysis id # and/or name.
After saving the diagram, the system will check the errors in modeling. If any error is found, the system will display a screen with the errors. Check the errors and save the record again. Thus, the diagram modeling will be complete.
|