FTA |
|
|
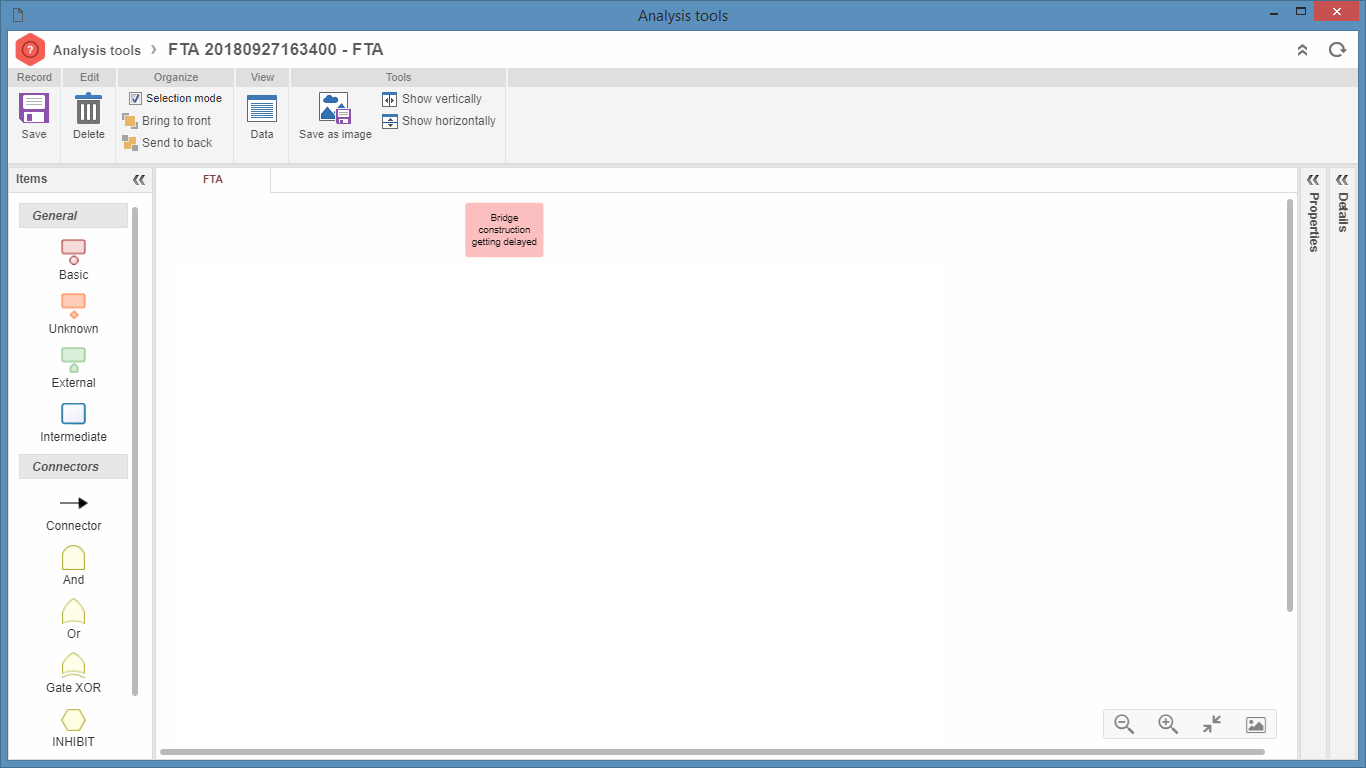
When selecting the "FTA" tool option, the following screen will be displayed:
In the diagram area, the box displayed arrow shows the defect/problem being analyzed. From the defect/problem, the user should provide details about other failures until reaching the basic events that are the limit of the diagram resolution. To do so, use the elements of General section of the Items panel, located on the left side of the screen. Select the desired item and drag it to the modeling screen.
After selecting the item (Basic, Unknown, External or Intermediate) that has been positioned in the diagram, the field in the Details panel, located on the right side of the screen, will be available to be filled out:
▪Cause: Enter the defect cause. In this field it is possible to associate an existing cause or to record a new cause. Use the options located below this field to define if this particular cause is a Root cause or a Potential cause of the defect/problem. ▪Percentage: Enter the percentage to show how likely it is that this cause has generated the defect/problem under analysis. ▪Responsible department: Enter the responsible department for the cause. ▪Description: Enter a description for the cause.
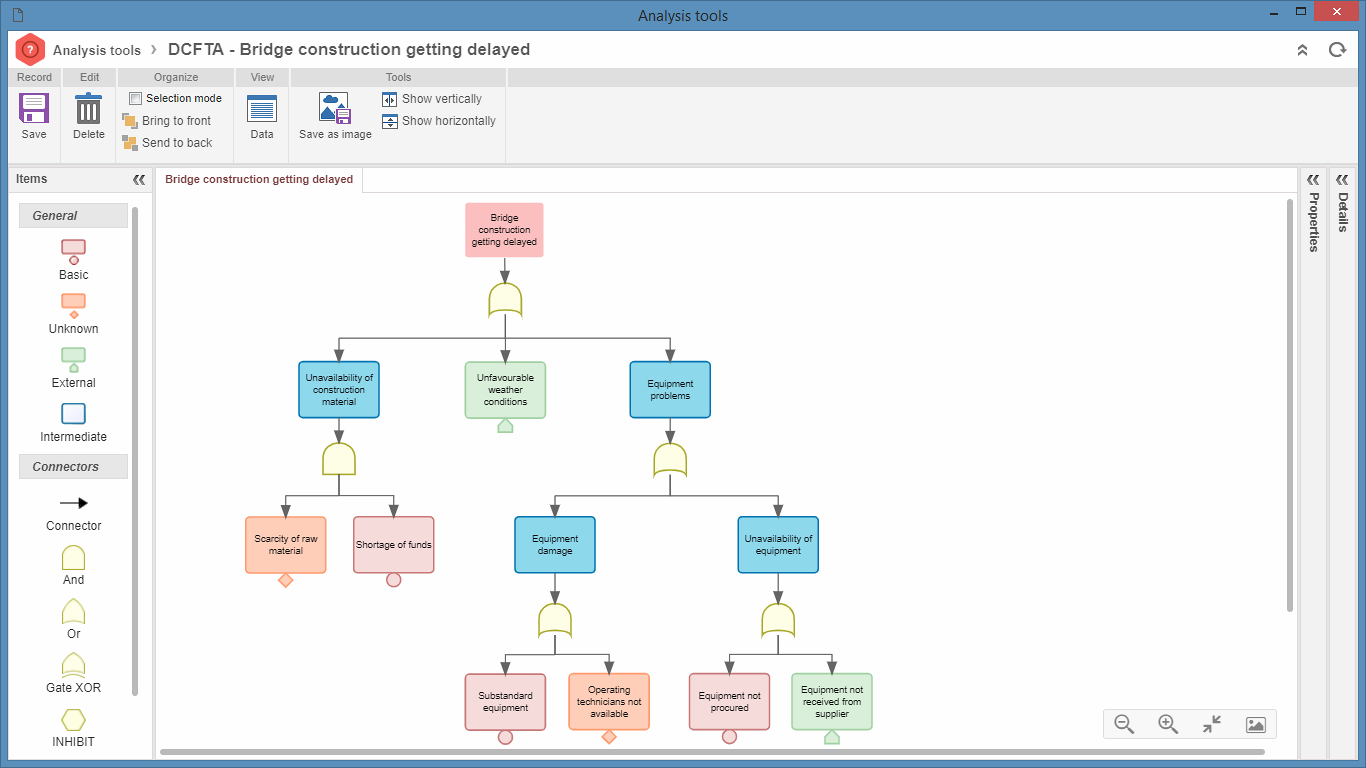
In the Connectors section of the Items panel, find the logical elements that can be added to the diagram, such as: AND, OR, Gate XOR, INHIBIT or Gate voting OR to illustrate better the relationship between failures. Consequently, it is possible to use the diagram to calculate the probability of some failure from more specific events. As with the other elements of the diagram, select the logical operators and drag them to the desired position in the diagram;
Still in the Connectors section, use the Connector item to interconnect the defect with the causes. To do that, after the user clicks on the connector, the mouse cursor will change to an arrow. Click on the first element and then on the second. An arrow will connect the two items. Repeat the procedure to make the connection between all the items.
Use the Properties panel to apply advanced configurations (background color, border color, width, font color, align, shape among others) to the items of the diagram being modeled.
After saving the diagram, the system will check the errors in modeling. If any error is found, the system will display a screen with the errors. Check the errors and save the record again. Thus, the diagram modeling will be complete.
|