Ishikawa |
|
|
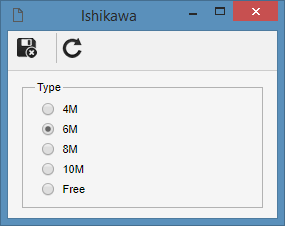
when selecting the "Ishikawa" tool option, a screen to select the quantity of types or categories to be used to classify the defect or problem causes will be displayed.
▪4M: This type has 4 categories of problems, which are: Machine, Method, Material and Manpower. ▪6M: This type has 6 categories of problems, which are: Machine, Method, Material, Manpower, Measurement and Environment. ▪8M: This type has 8 categories of problems, which are: Machine, Method, Material, Manpower, Measurement, Environment, Management and Raw material. ▪10M: This type has 10 categories of problems, which are: Machine, Method, Material, Manpower, Measurement, Environment, Management, Raw material, Sales and. Finances ▪Free: In this type, categories must be manually defined. If this type is set, the "Category" item will be displayed on the items panel.
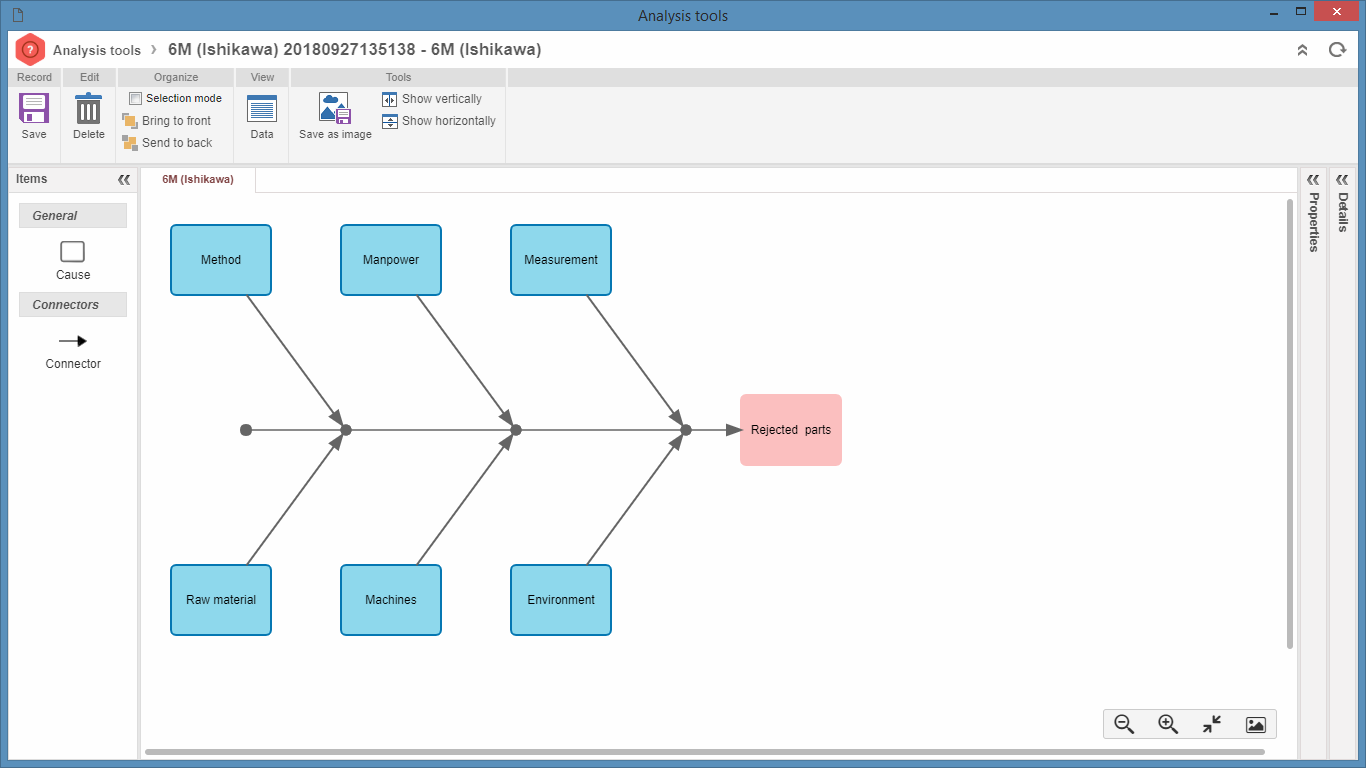
After defining the type, the Ishikawa diagram screen will be displayed. In the diagram area, the box positioned at the tip of the main arrow shows the defect/problem being analyzed. The other boxes in the diagram show the causes categories, which vary according to the previously selected diagram type (4M, 6M, 8M and 10M).
If the selected type is "Free", it will be possible to define how many categories are necessary. In this case, drag the "Category" item outside of the diagram area and define all necessary categories. Next, connect the category to the defect/problem, using the Connector item: after clicking on the connector, the mouse cursor will change to an arrow. Click on the category item and, next, the defect. At this point, an arrow will connect both items. Repeat the procedure for every category that is associated with the analysis.
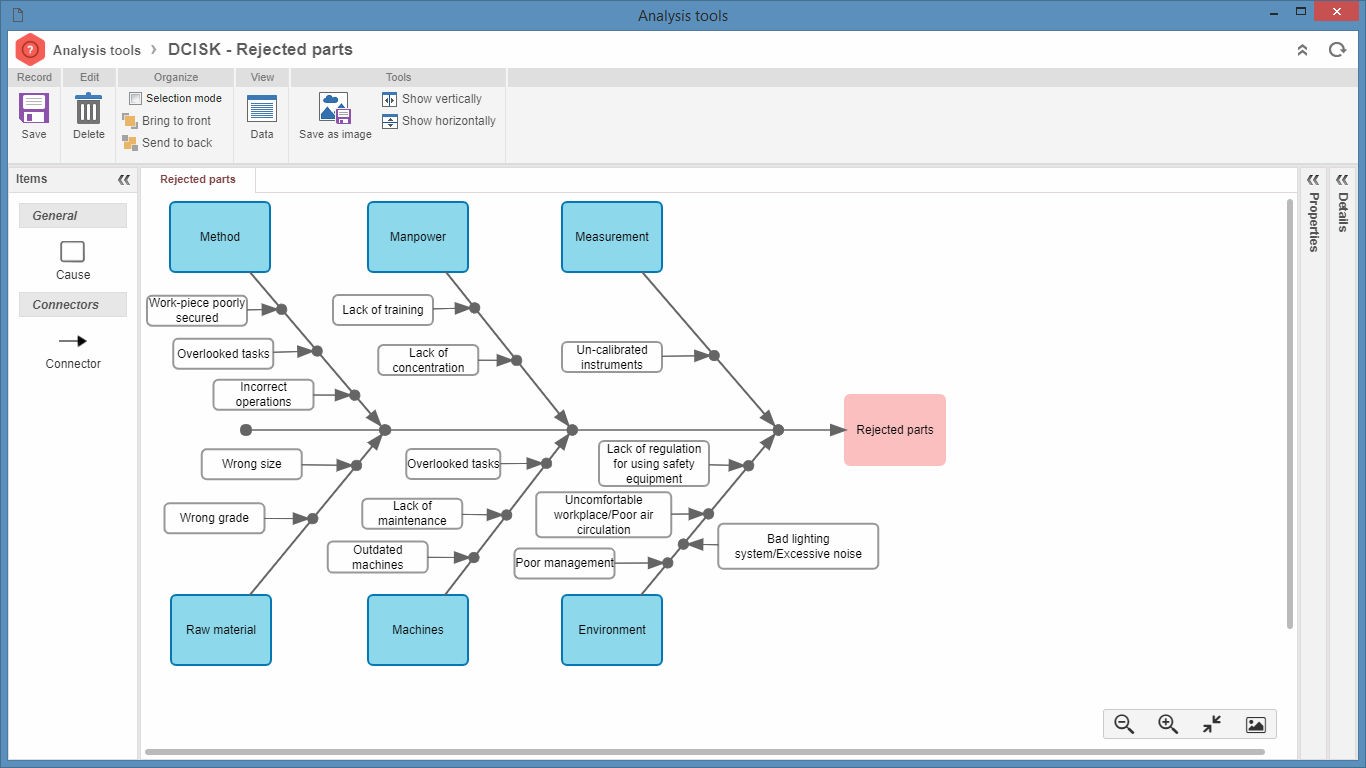
To enter the causes of the defect/problem, drag the Cause item to the diagram, next to the area of the category that classifies this particular cause. Next, with the selected cause item, fill out the following fields in the Details panel, located on the right side of the screen:
▪Cause: Enter the defect cause. In this field it is possible to associate an existing cause or to record a new cause. Use the options located below this field to define if this particular cause is a Root cause or a Potential cause of the defect/problem. ▪Percentage: Enter the percentage to show how likely it is that this cause has generated the defect/problem under analysis. ▪Responsible department: Enter the responsible department for the cause. ▪Description: Enter a description for the cause.
Use the Connector item to connect the cause to the category. To do that, after the user clicks on the connector, the mouse cursor will change to an arrow. Click on the cause item and then on the category. An arrow will connect the two items. Repeat the procedure for every cause that is associated with the analysis.
Use the Properties panel, located on the right side of the screen, for advanced configurations (background color, border color, width, font color, alignment, shape, and others) in the items of the diagram that is being modeled. Use the Data button, located on the toolbar, to change the analysis id # and/or name.
After saving the diagram, the system will check the errors in modeling. If any error is found, the system will display a screen with the errors. Check the errors and save the record again. Thus, the diagram modeling will be complete.
|