
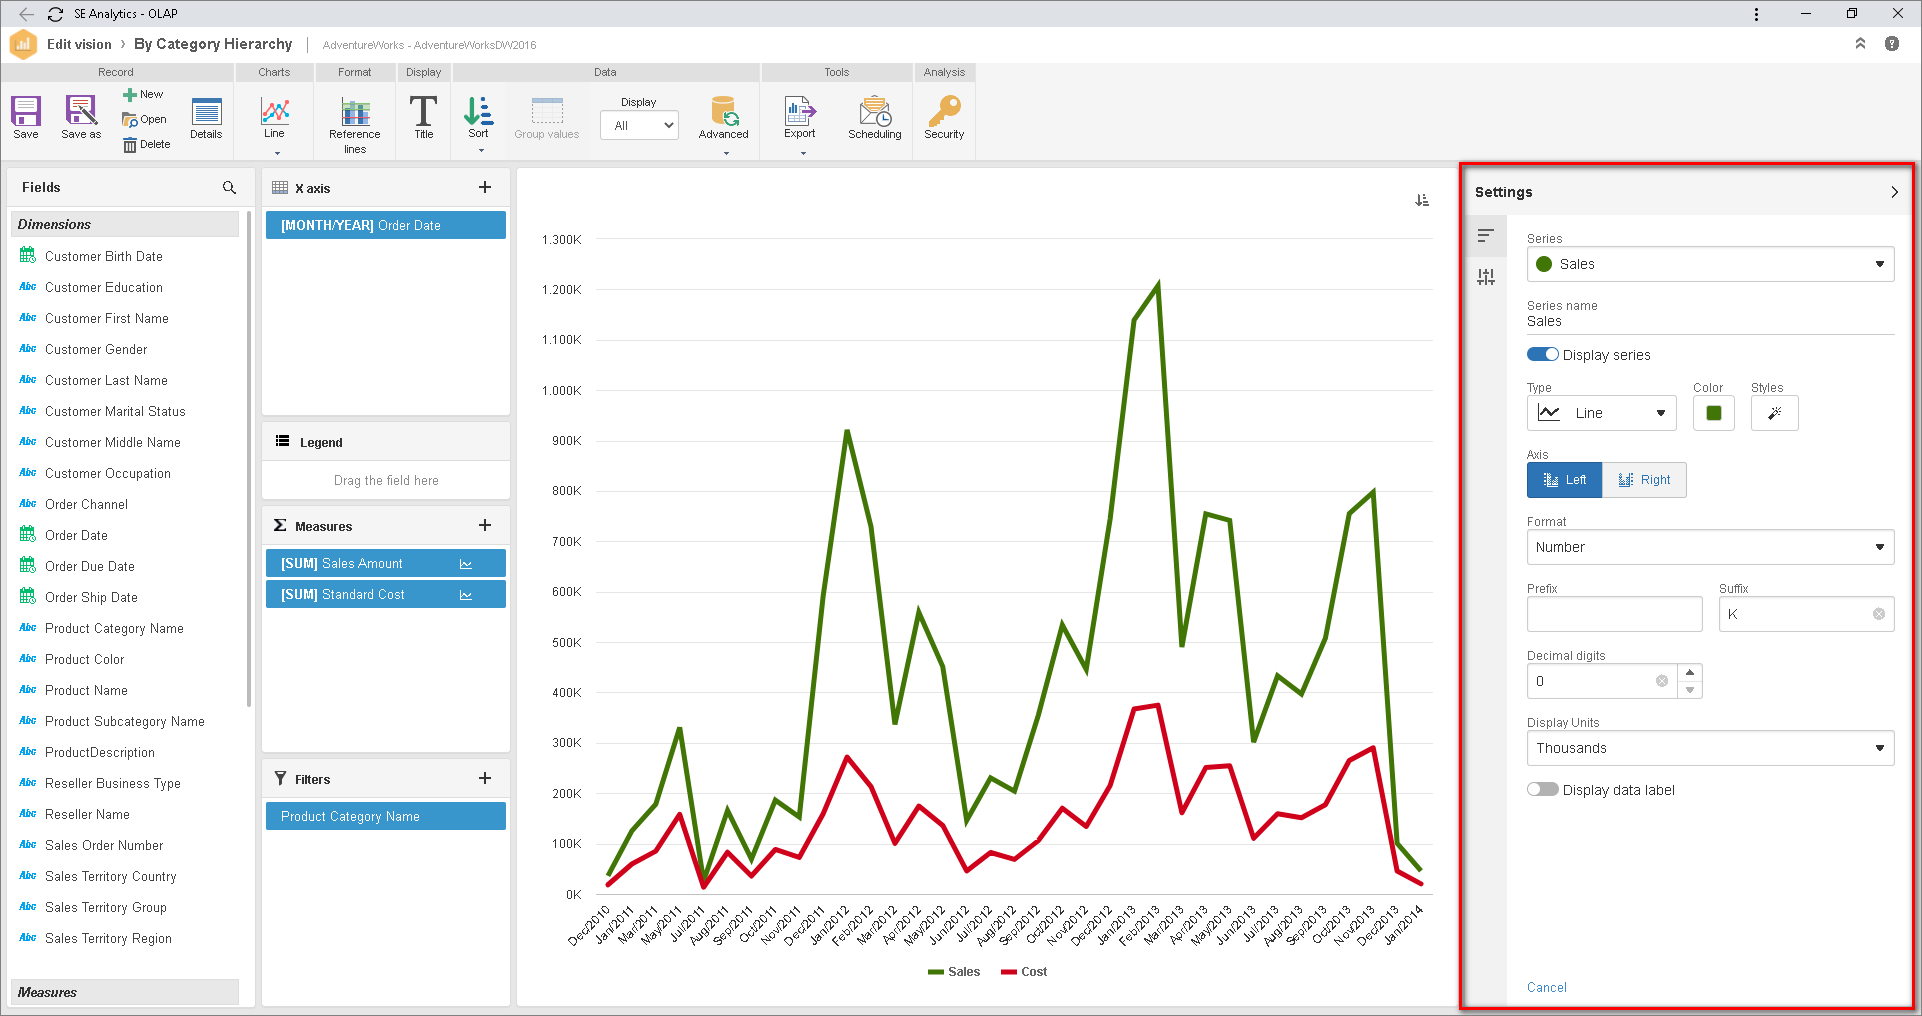
Panel for the configuration of properties and visual styles
From this version onwards, in the SoftExpert Analytics visions, it is possible to configure several properties and visual styles, such as colors, labels, axes, among others. The goal of this improvement is to allow visions to be according to the visual preferences of each customer, allowing colors, contrasts and other properties to be used strategically and to contribute to the understanding of the chart.
The configuration of these properties may be performed when creating or editing the visions, through a side panel available within OLAP.
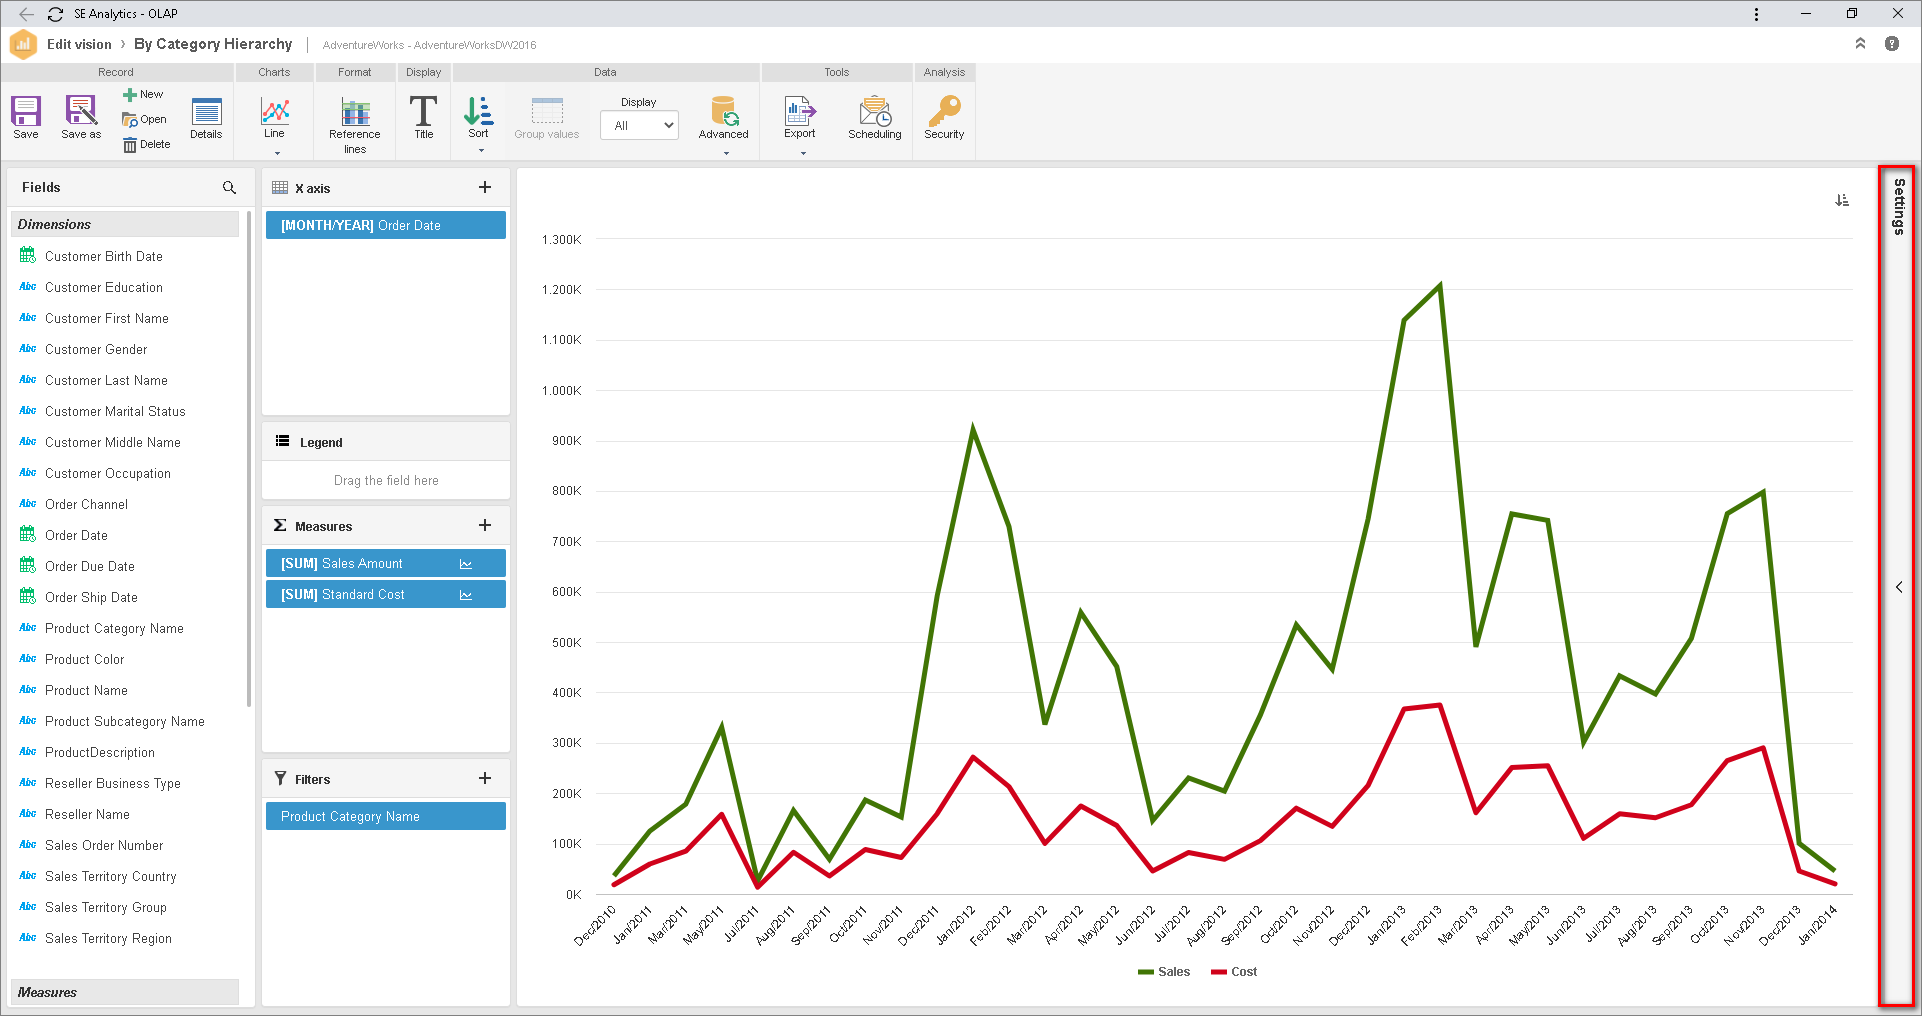
By default, this panel does not come enabled; to do so, simply access Analytics |


See the list of the main improvements available
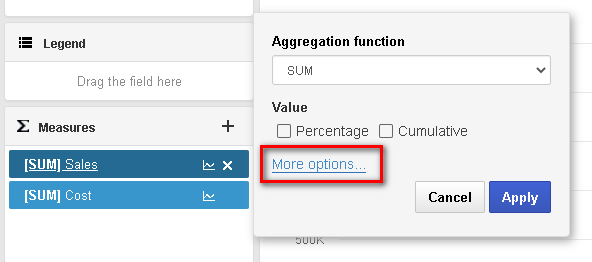
Shortcut for the new options
To facilitate the access to the panel and to the new configurations, now on the measurements, the More options shortcut has now been added. By clicking on it, the panel is expanded and the selected series is displayed for the user to perform the desired changes, such as changing the color, label, format etc.
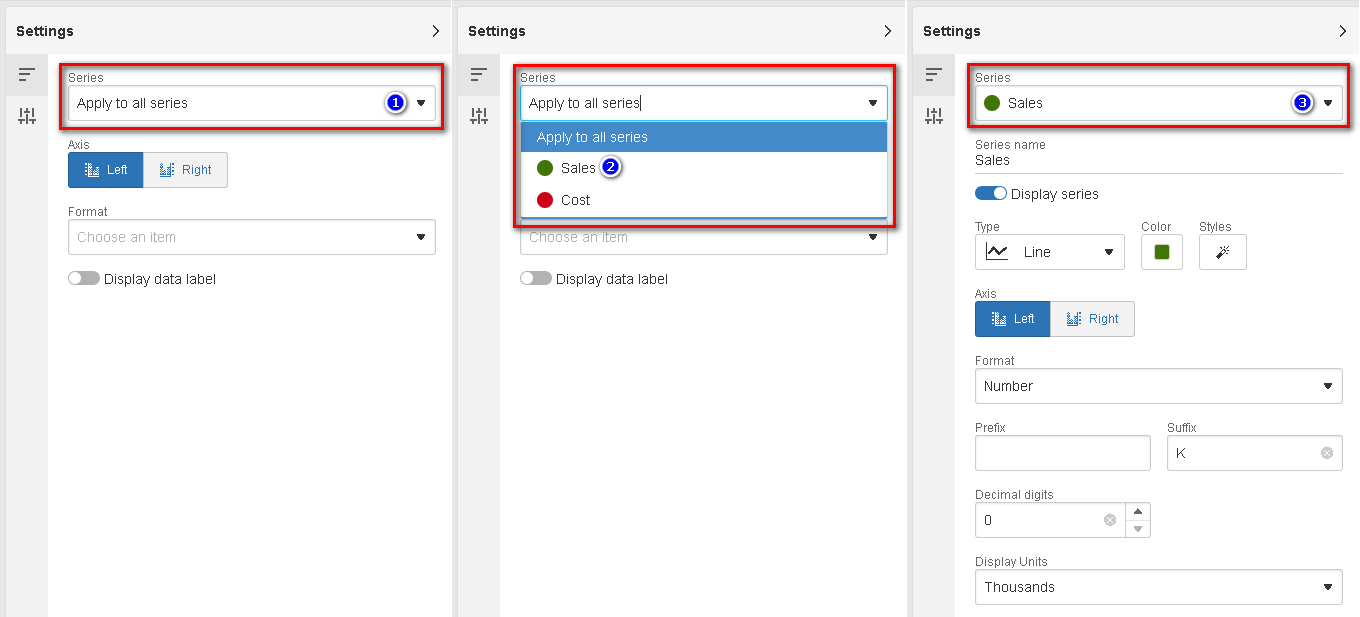
General change or per series
When the chart has more than one series, through the Series selector, it is possible to define whether the changes will be applied to all series or a specific series. To change several series at the same time, simply select the Apply to all series option. To change only one series, simply select the desired series and perform the changes.
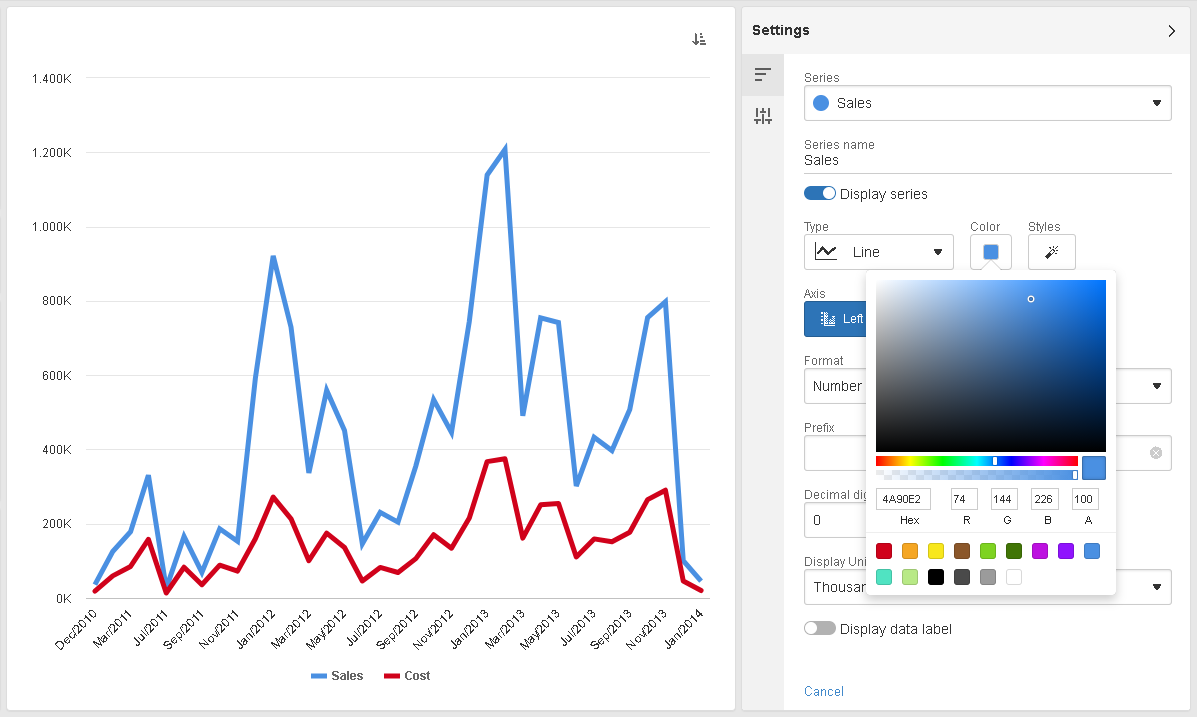
Series color
It is now possible to define a specific color for each series. To do that, simply select the series and define the desired color, through color selection or by entering its respective Hex or RGB code.
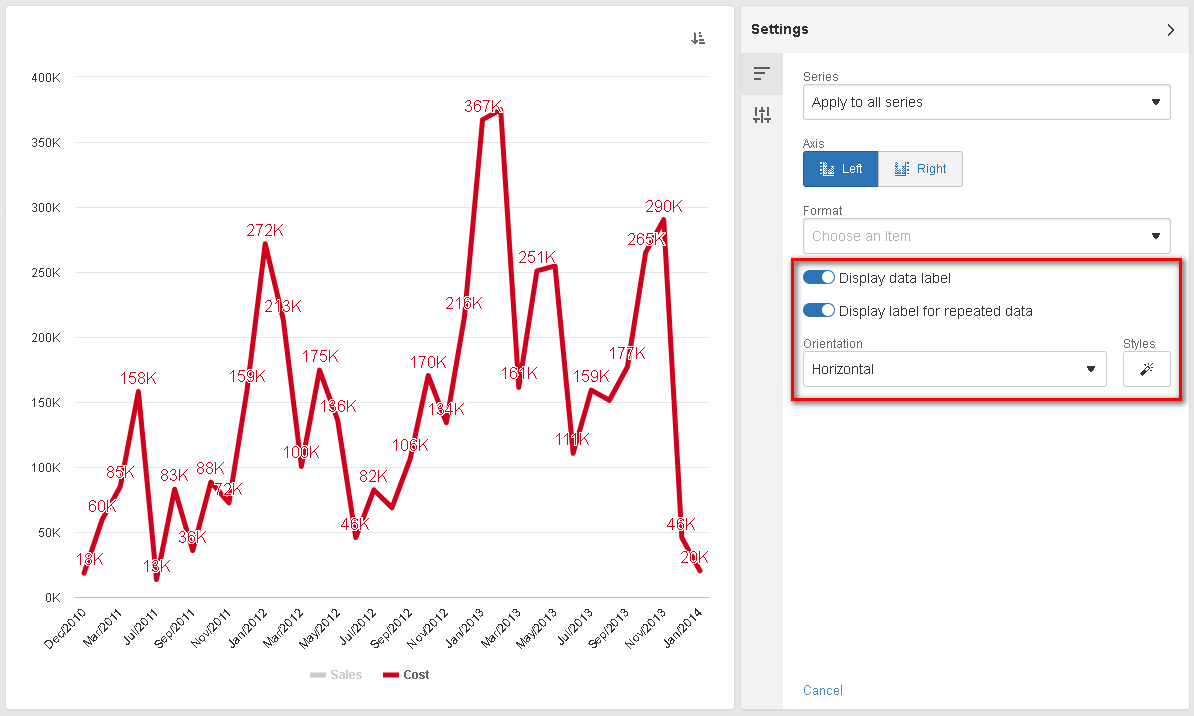
Data labels
Aiming to meet the specific needs of each customer on the data labels, which could vary even from chart to chart, it is now possible to customize the orientation, font size, color, among others.
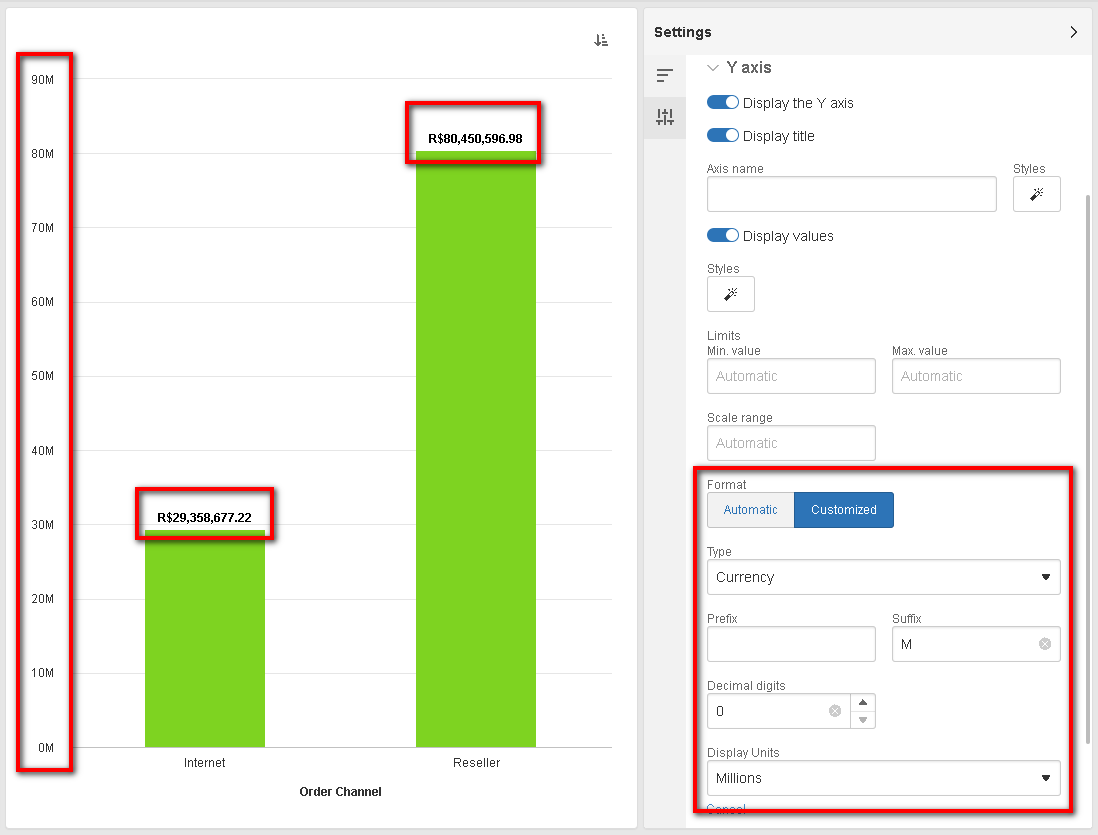
Axis scale format
By default, the axis format is still the same format of the first series assigned to the axis, and the axis is automatically updated when the series format is changed. From this version onwards, it is possible to configure a customized format for the axis, which is useful, for example, to have the axis in the millions range with zero decimal places and the series in the absolute range with two decimal places.
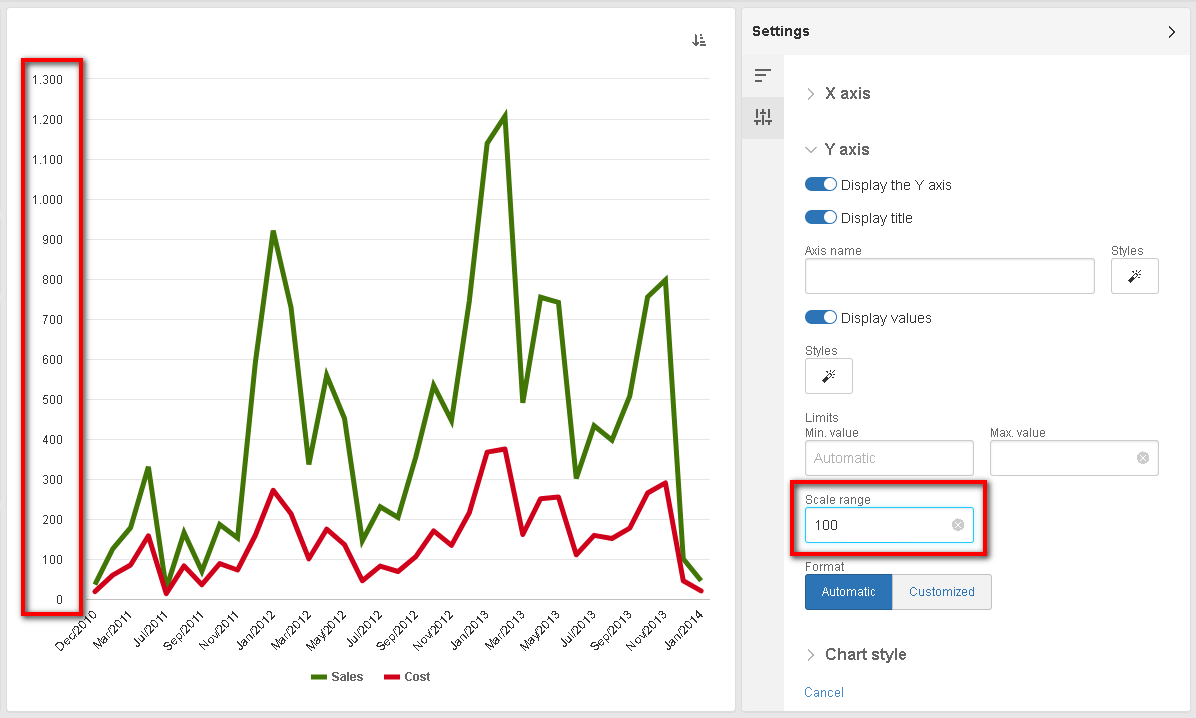
Axis scale range
Up until now, the axis markers were automatically defined by the system. Now, in the axis configurations, it is possible to configure the range in which the markers must be created in the axis; for example, when defining the range as 100, the first row will be in the 100, the second in the 200 and so on.
Visions of the Table, Pivot table, Pareto, Radar, Meter, and Number types currently do not support customization; the panel will be collapsed and disabled. In a future version, these types will also be customizable. |
Previous versions
View also the improvements made to this component in previous versions:
