|
On the toolbar of the screen used to create OLAP analysis visions, the user can find several buttons and menus divided in the following sections:
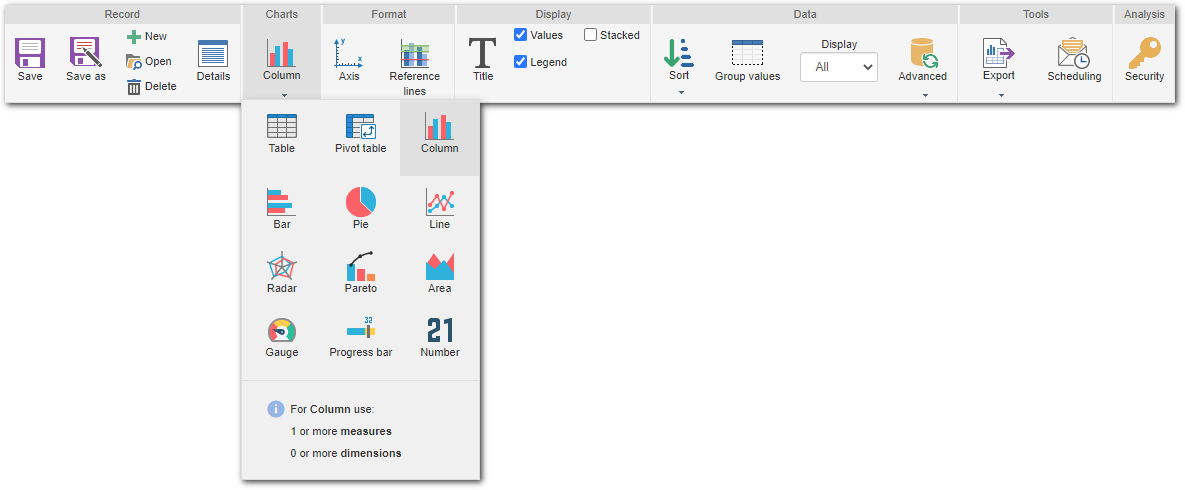
Record
|
Save
|
Click on this button to save the vision. When the vision is saved for the first time and the user clicks on this button, the system will ask the user to enter a name for the vision. Note: If the vision/OLAP is being accessed through a system menu, then, when saving the record for the first time, the "Display in the menu where the vision was created" option will be displayed; if checked, it will make the analysis available in the menu in which it was created.
|
Save as
|
This button will be displayed after the vision is saved or when the vision is being edited. Click on this button to save the changes made as another vision. When the user clicks on this button, the system will require a name for the new vision to be entered. Note: If the vision/OLAP is being accessed through a system menu, the "Display in the menu where the vision was created" option will be displayed; if checked, it will make the analysis available in the menu in which it was created.
|
New
|
Click on this button for the OLAP screen to be reloaded so that a new vision is created for the analysis.
|
Open
|
Click on this button to open a vision or an analysis that has already been recorded in the system.
|
Delete
|
This button will only be displayed when the view has already been saved. Click on this button to delete the vision being viewed or edited. After clicking on this button, the system will display a message asking whether you truly wish to delete the record.
|
Details
|
Click on this button to view the vision details. A screen that allows renaming the analysis will be displayed. Note: If the vision/OLAP is being accessed through a system menu, the "Display in the menu where the vision was created" option will be displayed; if checked, it will make the analysis available in the menu in which it was created.
|
Styles
|
Conditional format
|
Click on this button to configure a formation in values that will be highlighted in OLAP if a certain condition is met. This option will only be displayed for charts of the following types: Table, Pivot table and Number. Refer to the Conditional format topic for further details on this configuration.
|
Format
|
Axis
|
Click on this button to configure the exhibition of the chart axis information. This configuration will only be available for charts of the following types: Column, Bar, Line, Area, Radar and Pareto. Refer to the Axis topic for further details on this configuration.
|
Reference lines
|
Click on this button to add reference lines to the chart. This configuration will only be available for charts of the following types: Column, Bar, Area and Pareto. Refer to the Reference lines topic for further details on this configuration.
|
Axis/Reference line
|
Click on this button to configure the chart values, scale and reference lines. This configuration will only be available for charts of the following types: Gauge and Progress bar. Refer to the Axis/Reference lines topic for further details on this configuration.
|
Display
|
Title
|
Click on this button to define the title and subtitle to be used in the analysis.
|
Total
|
Check this option to display the total values in the lines and columns. Note: This option will only be displayed for charts of the following types: Table, Pivot table.
|
Values
|
Check this option for the values to be displayed in the charts. Note: This option will only be displayed for charts of the following types: Column, Bar, Line, Pie, Area, Radar and Pareto.
|
Percentage
|
Check this option so that the chart results are displayed as a percentage instead of values. Note: This option will only be displayed for the Pie chart.
|
Caption
|
Check this option to display the chart caption. Note: This option will only be displayed for charts of the following types: Line, Pie, Area and Radar.
|
Stacked
|
Check this option so that the values appear inside the bars or columns, instead of being displayed above the columns or next to the bars. Note: This option will only be displayed for charts of the following types: Column and Bar.
|
Line values
|
Check this option to display the line value. Note: This option will only be displayed for the Pareto chart.
|
Pointer value
|
Check this option for the chart pointer value to be displayed. Note: This option will only be displayed for charts of the following types: Gauge and Progress bar.
|
3D
|
Check this option to display the 3D chart. Note: This option will only be displayed for charts of the following types: Column, Bar, Pie and Pareto.
|
Data
|
Sort
|
Click on this button to configure the sorting of the vision/OLAP fields. Refer to the Sorting topic for further details on this configuration.
|
Grouping values
|
Click on this button to configure the grouping of certain vision/OLAP values. Refer to the Grouping values topic for further details on this configuration.
|
Display
|
Enter, in this field, the number of results that will be analyzed in the vision/OLAP.
|
Advanced
|
By clicking on this button, a menu will be displayed, allowing the user to enable the use of cache for the vision data when it is published in a portal. This resource is useful for those analyses with information that is not frequently edited, as portal users do not need to wait until the information is loaded. Refer to the Configuring vision cache topic for further details on this configuration.
|
Tool
|
Export
|
By clicking on this button, a menu will be displayed with the export options:
Vision (PNG): Select this option to export the vision to an image.
Vision (XLSX): Select this option so that the vision data is exported to an Excel spreadsheet.
Analysis data (XLSX): Select this option so that all analysis data is exported to an Excel spreadsheet.
|
Scheduling
|
Click on this button to configure the schedule for sending e-mail with an attached vision.
|
|