
Web service to create and edit tasks
Aiming to facilitate the creation of tasks in Kanban, the web service to create and edit tasks has been made available. The feature enables the integration with other Suite products and/or external services.
Task deadline
Aiming to improve control in finishing tasks within their deadlines, the system now stores information regarding the task closure date. This information is now available in task view and Analytics, allowing the user to create analyses related to those fields.
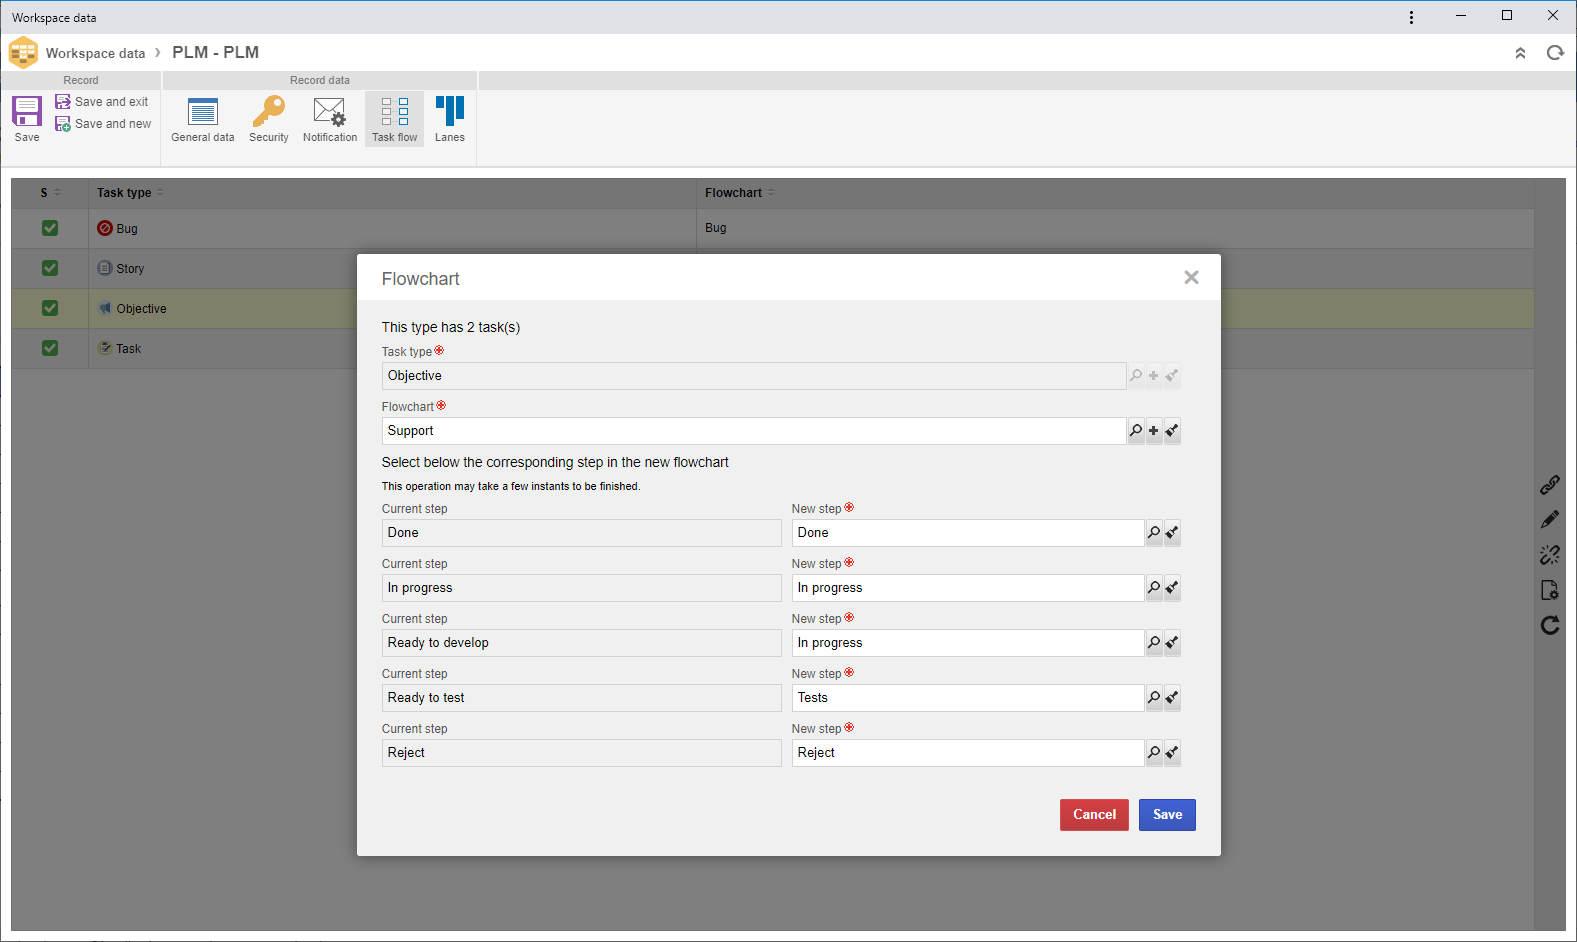
Change and inactivate a workspace task type flow
For better control over the flowchart and usage of task types of a workspace, from this version onwards, the system allows changing the flowchart associated with the task type. With this feature, if it is necessary for the task type to have a new flowchart, simply change the flowchart to the desired one and enter the step to which the flow tasks must migrate.
The feature also allows the user to inactivate a task type. Thus, if the task type is no longer used, new tasks cannot be created for it, facilitating management without impacting the workspace task history.
Kanban widgets
Aiming to facilitate the process to analyze the kanban tasks, this version makes available widgets to use the component. The charts use the Analytics structure, which allows great flexibility to change information according to the needs of the customer, such as applying filters or adjusting charts.
The widgets that were made available will be described below.
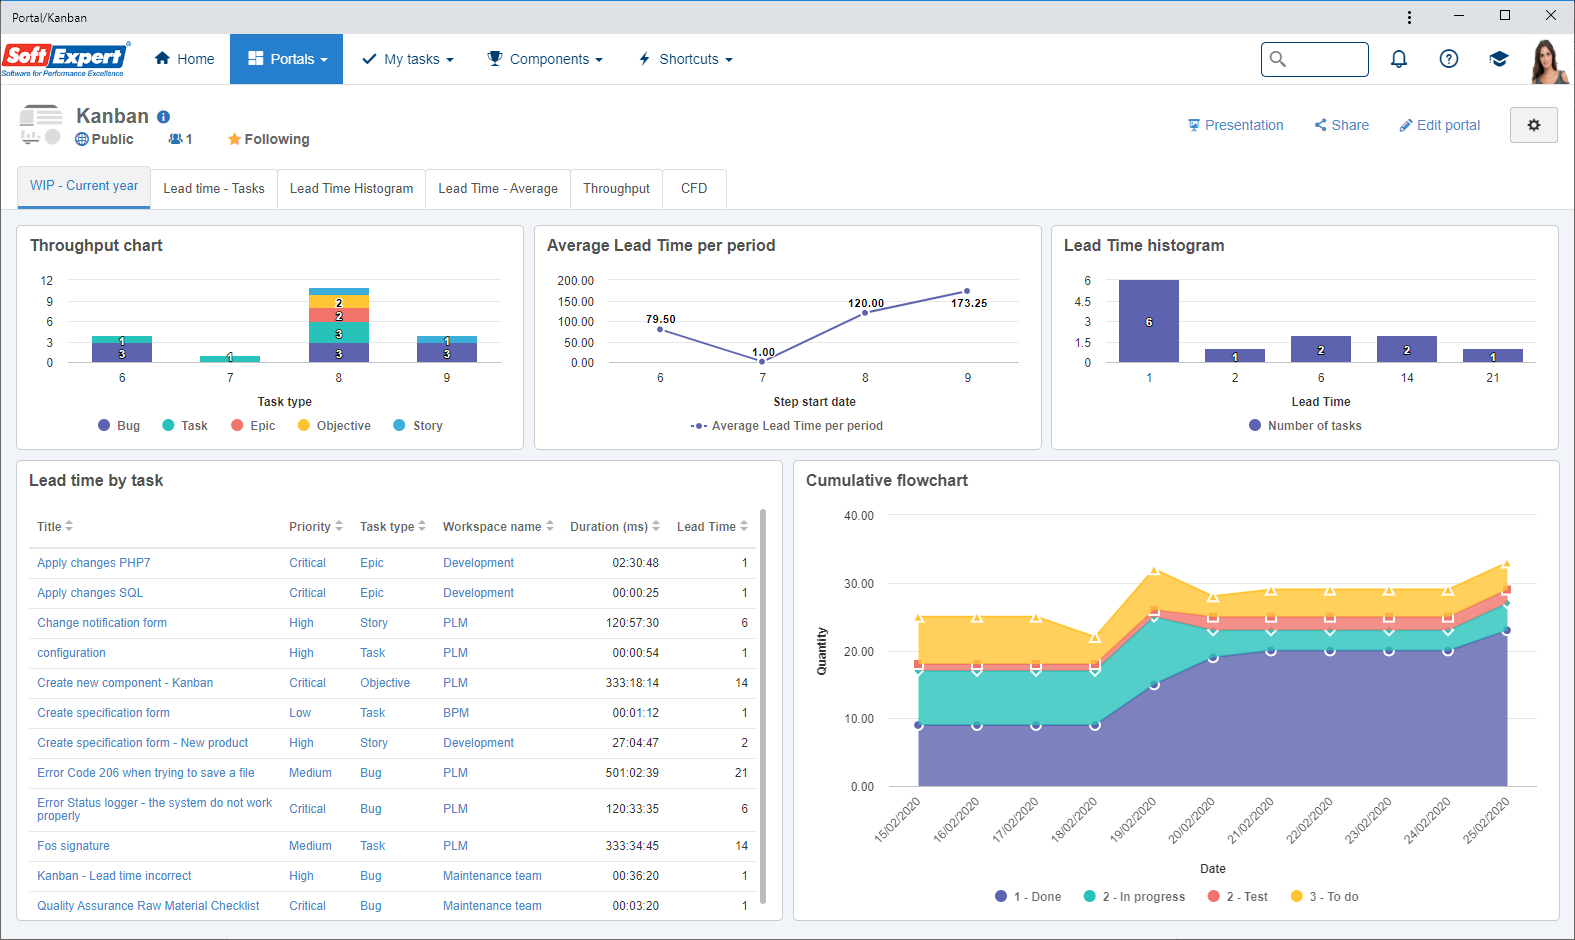
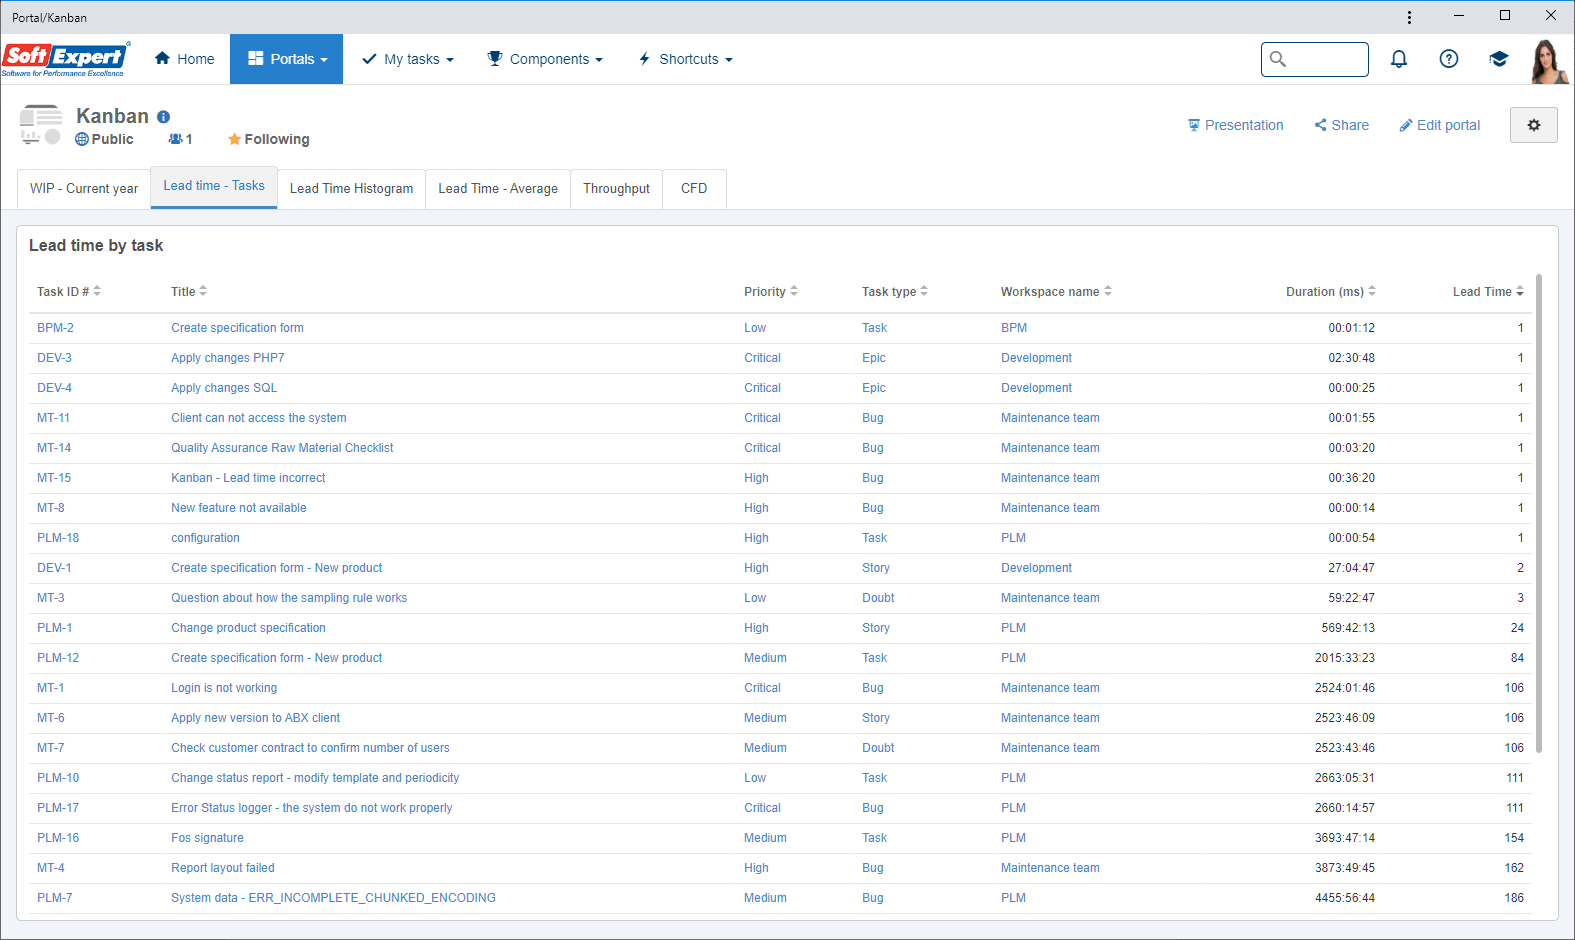
Lead time by task widget
The lead time widget displays the total duration of a task, from its creation to its closure. This analysis allows tracking each task individually, allowing a more detailed analysis in situations that may differ from the process. In addition to the displayed information, if necessary, it is possible to divide the time into hours, such as the time in each step of the flow, facilitating the identification of bottlenecks in the flow.
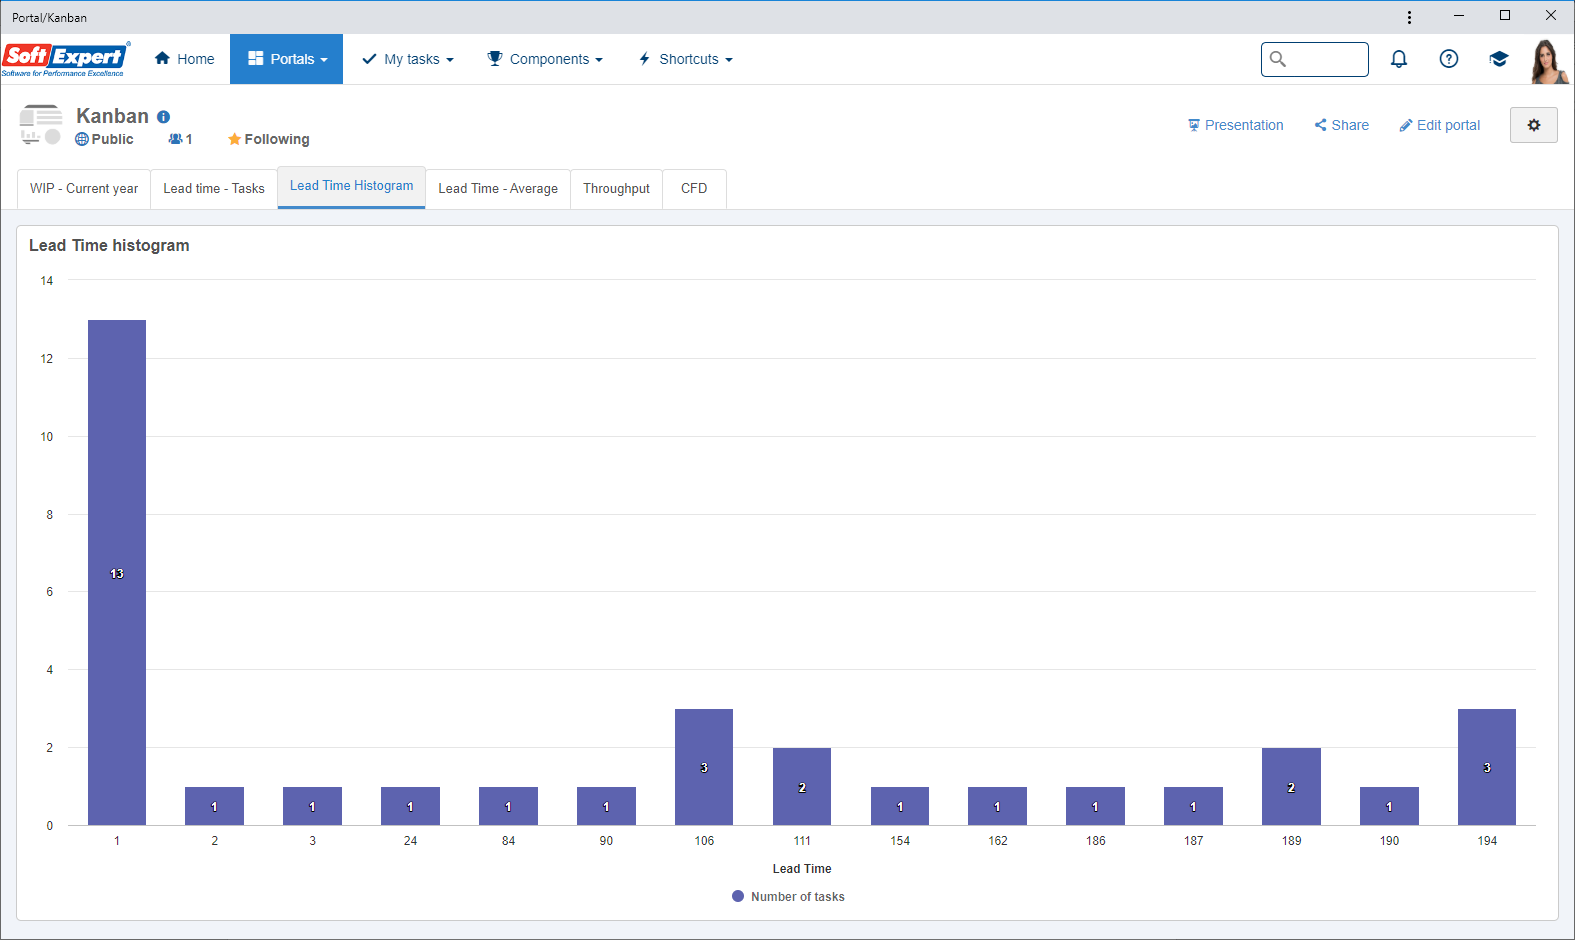
Lead Time histogram widget
The lead time histogram displays information of tasks grouped by their lead time. This analysis allows tracking the variation in the process, as well as identifying attention points in the flow, as it is easier to identify tasks with a higher lead time than normal.
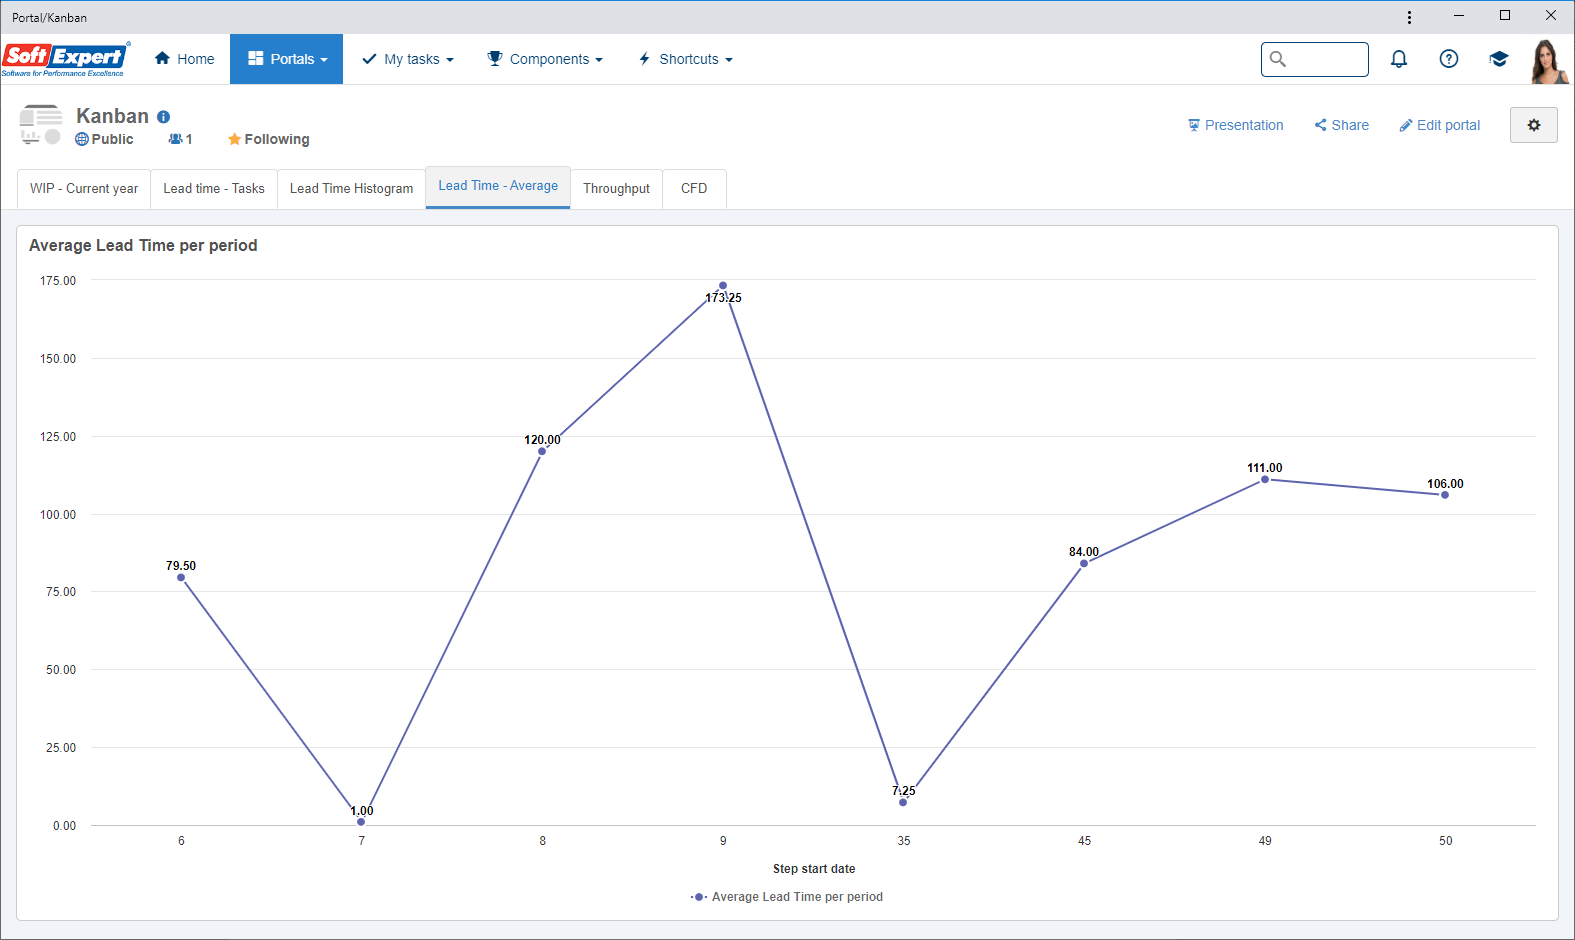
Average Lead Time per period widget
The average lead time per period chart displays the evolution of the lead time throughout time, using the average lead time per period as information.
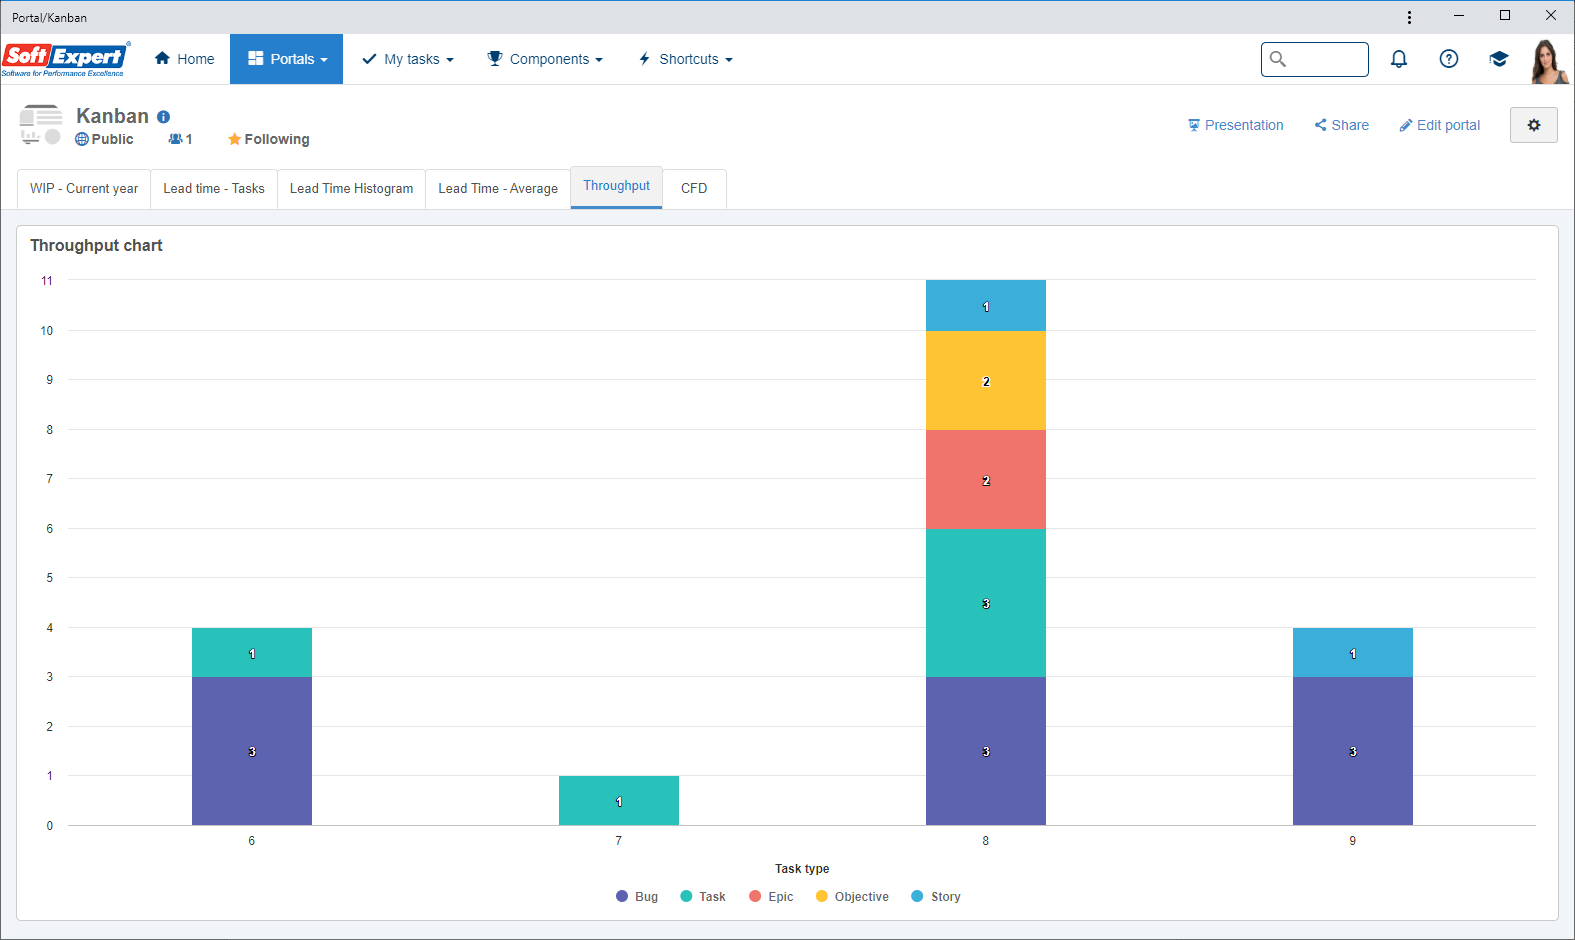
Throughput widget
The throughput widget represents the number of tasks finished within a certain period. With the chart, it is possible to analyze the deliveries of the period, if the tasks are being finished, if the number of delivered tasks is increasing or decreasing.
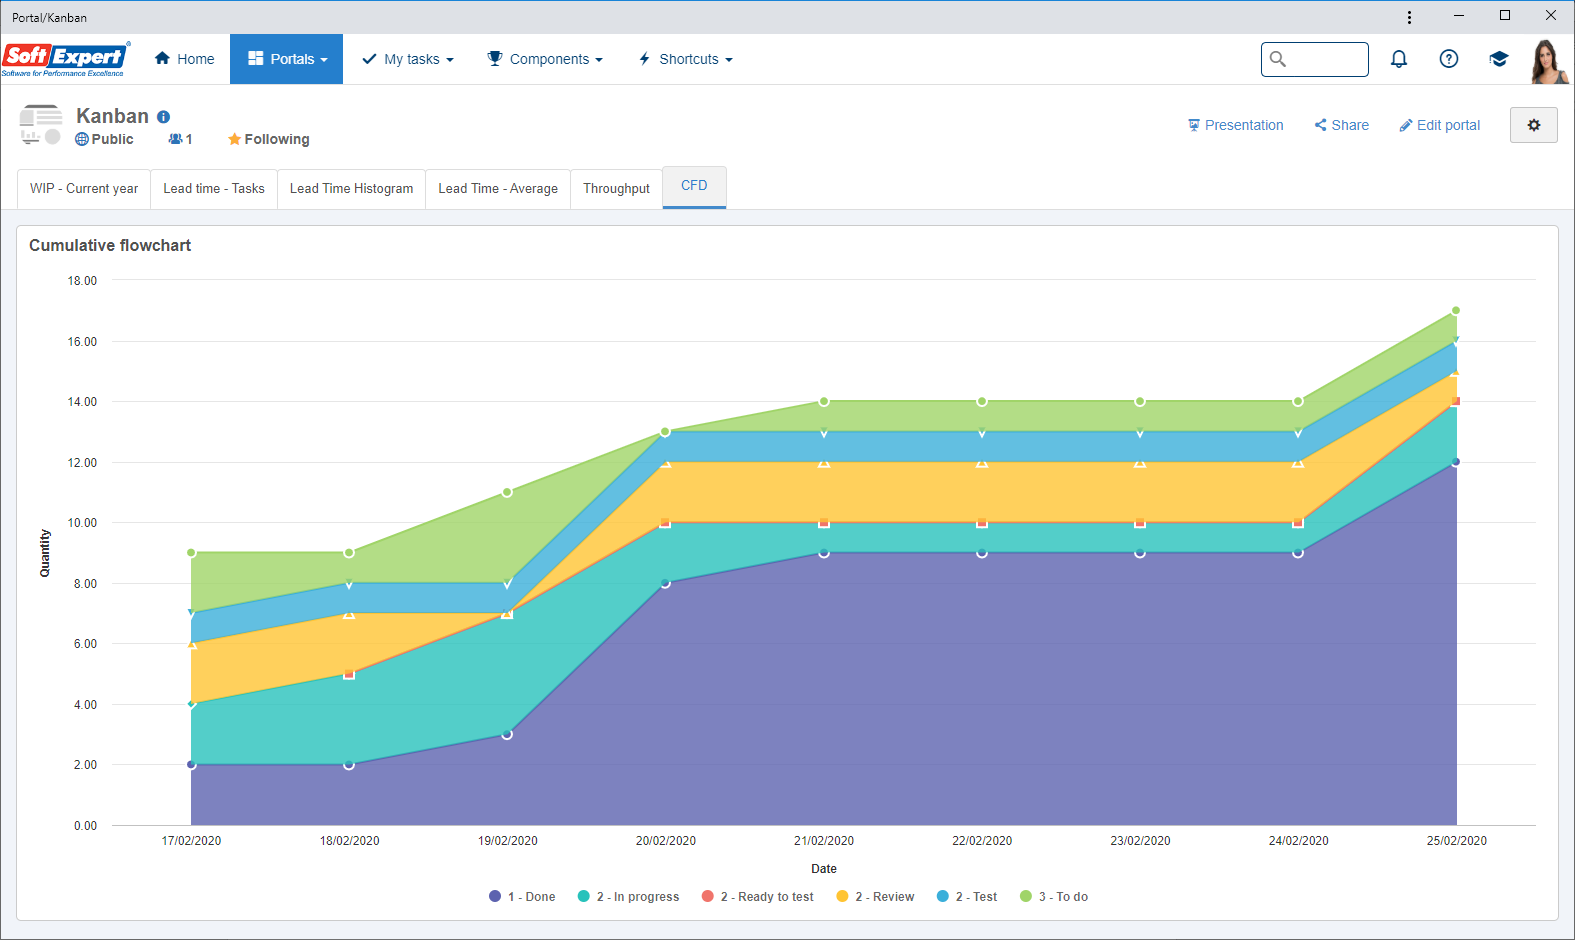
CFD widget
The cumulative flow diagram is a chart to track what is happening during task flow. With the chart, it is possible to understand the evolution of the process by tracking the number of to-do tasks, what is in progress and what has been finished. The chart is divided into each step of the flow, allowing the user to analyze possible attention points of the flow.
Previous versions
View also the improvements made to this component in previous versions:
