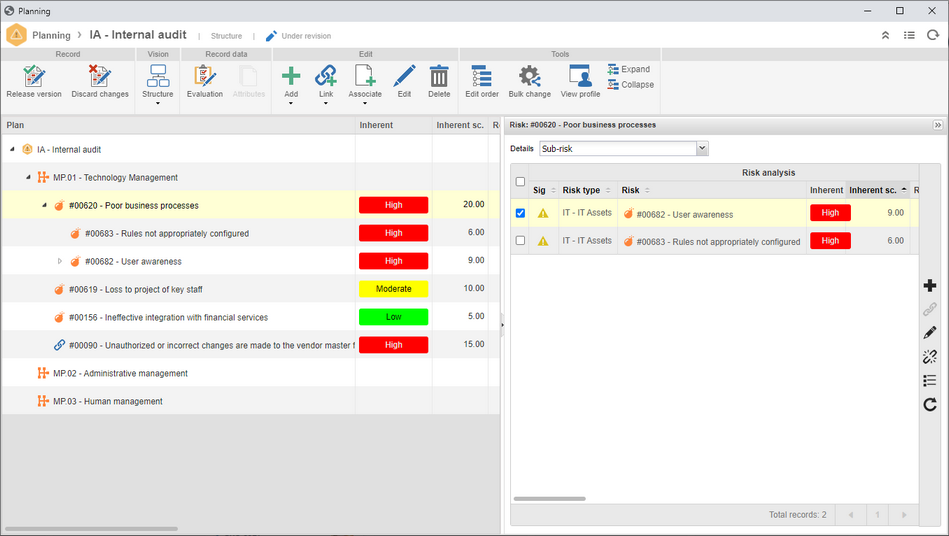
Plan structure with sub-risk
It is now possible to create nested risk analyses, named sub-risks. Thus, it is possible to assemble an analytical structure of the risks to identify the main correlations between them.
With this feature, it is possible to assemble flexible risk structures with detailed visions of the causes and impacts of the risks.
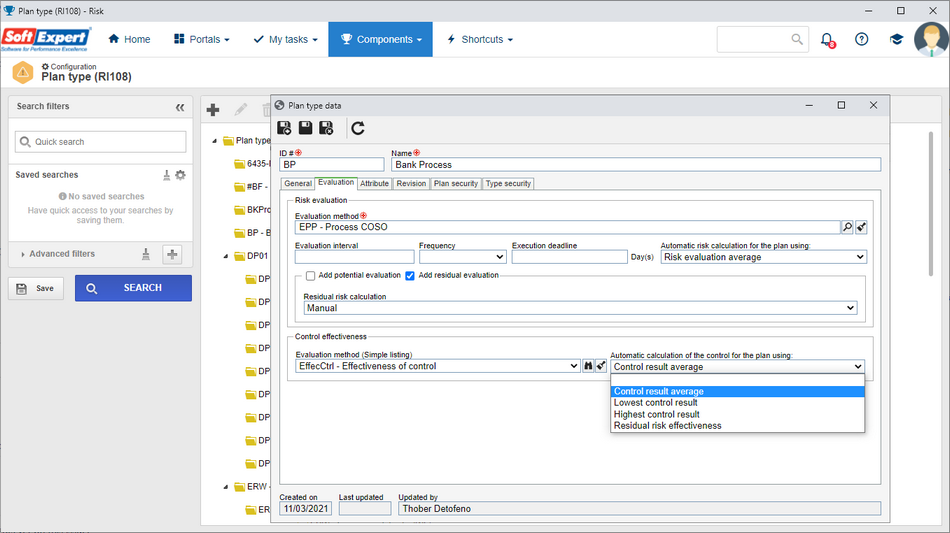
Automatic calculation for the control effectiveness %
Just as there is the automatic calculation for the risk, the control effectiveness automatic calculation is available.
Thus, for controls whose effectiveness is evaluated, it will be possible to analyze the value grouped by Plan, Process, Risk, or Element of the plan structure.
Four calculation options are available: Average, Highest, or Lowest control result values, and Residual risk effectiveness.
Three calculations are based on the evaluated control values, but the residual risk effectiveness calculation uses the entered risk evaluation values. This calculation is suggested when the organization does not know the effectiveness of the controls.
New automatic risk calculation
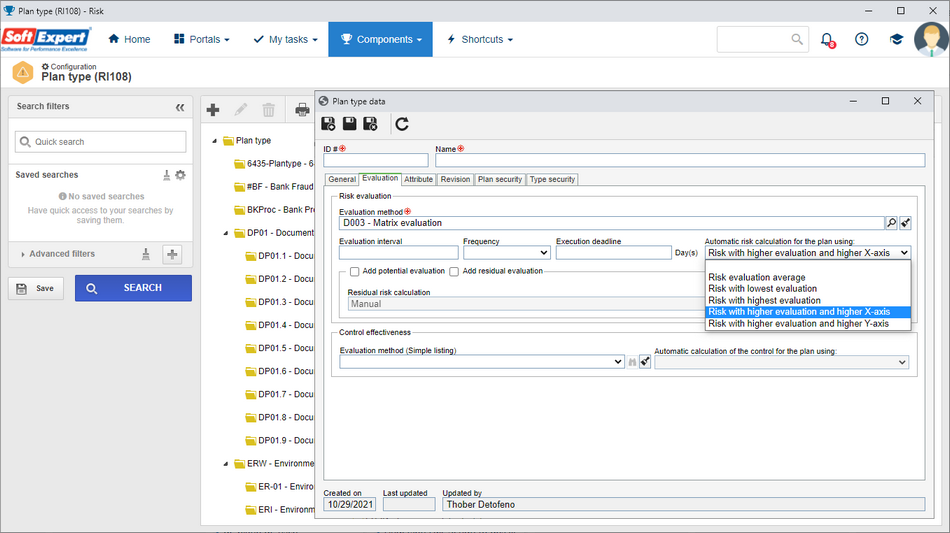
The automatic risk calculation, configured in the plan type, aims to provide an evaluation for elements with risk analyses, consolidating the evaluations of all element risks.
As the product reaches more customers and users, new calculations are made available to meet the management rules of our customers.
When using risk evaluations of the Matrix type, two new calculation options were made available in the automatic risk calculation: Risk with higher evaluation and higher X-axis (e.g. result of the risk with higher result and higher impact) and Risk with higher evaluation and higher Y-axis.
Both new options work in a similar way, giving priority to the highest result, but in cases of two equal evaluations, priority will be given to the risk value with higher X or Y axis (that is, higher Impact or Probability).
For example:
Consider 3 risks, as displayed in the table below.
Risks |
Probability (X axis) |
Impact (Y axis) |
Result |
Risk 1 |
3 |
4 |
12 |
Risk 2 |
4 |
3 |
12 |
Risk 3 |
1 |
5 |
5 |
Two risks have the same result (Risk 1 and Risk 2 with the result of 12), but the Impact and Probability criteria are different.
The table below displays the three calculations that use the highest evaluation risk value.
Automatic risk calculation (Options) |
Probability |
Impact |
Result |
Risk with highest evaluation |
4 |
5 |
20 |
Risk with higher evaluation and higher X-axis (higher probability) |
4 |
3 |
12 |
Risk with higher evaluation and higher Y-axis (higher impact) |
3 |
4 |
12 |
The 3 risks above display the difference according to the automatic calculation option selected for the risk.
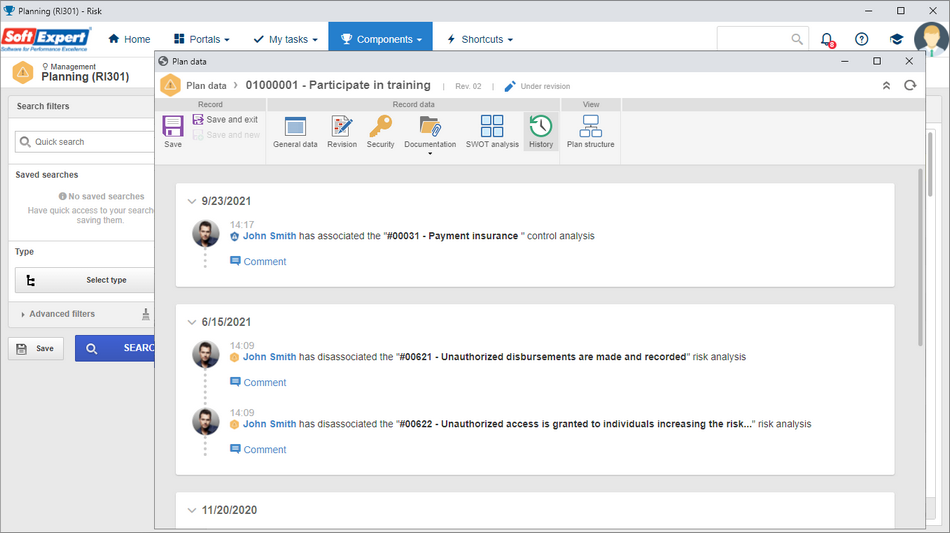
Standardization and new history for Plan, Risk, and Control
The plan, risk analysis, and control analysis histories are an important feature to understand the risk and the control and their evolutions, as well as to support the audit, displaying the traceability of everything that happened with the risk or the control.
Thus, we have standardized the display of the History on the risk analysis, control analysis, and plan data screens, and we have added new histories. There are currently over 100 operations exclusive to the risk that generate history events for the risk analysis, control analysis, and plan.
Creating a new plan from an obsolete revision
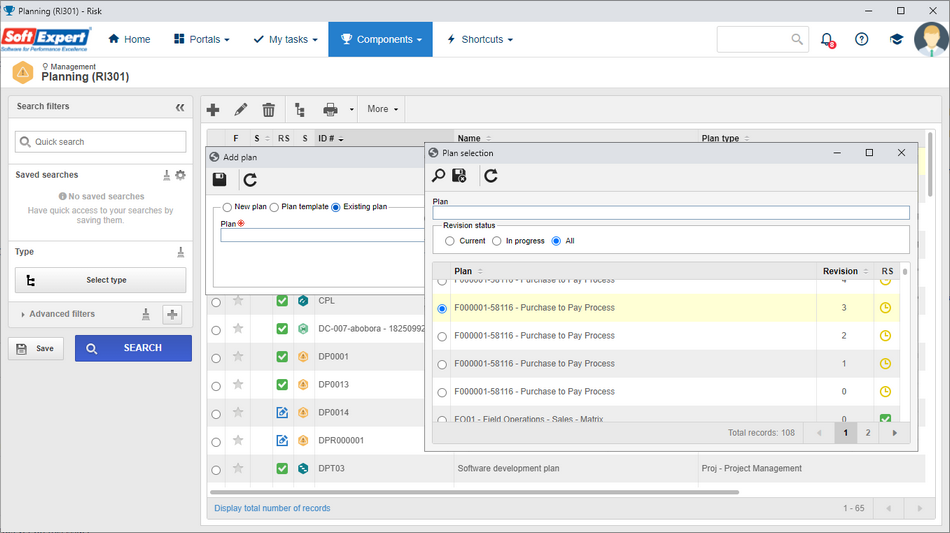
Until this version of SE Suite, it was possible to create a plan copy from released revisions only. From this version onwards, we allow selecting an obsolete revision of a plan.
To do that, when adding a new plan, simply select the "Existing plan" option and the list of plans available to be selected will display the obsolete revisions, according to the selected filter.
New Analytics link to access plan data
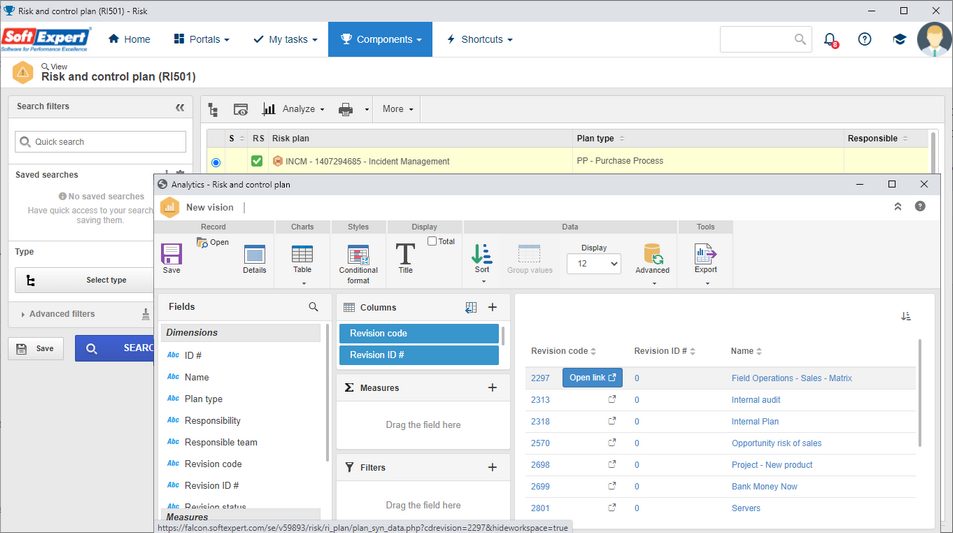
From this version onwards, the option to open the risk and control plan screen from "Open link" in the tables created in Analytics has been made available.
Currently, risk analyses and control analyses already have these links, and now so do plan data.
New function for the residual risk formula
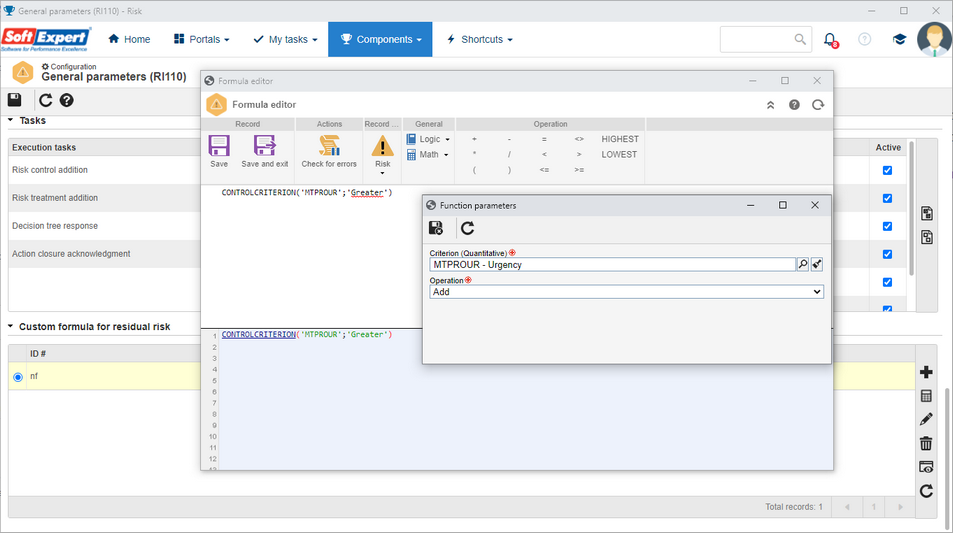
Companies aim to customize the residual risk calculation according to their organizational contexts. Thus, we have made available another function to aid in customizing the residual risk calculation.
The "Control criteria" (CONTROLCRITERION) function obtains the values from a quantitative criterion used in the risk analysis control effectiveness evaluations. That is, when control analyses associated with a risk analysis are evaluated, this function takes the value from one of the desired criteria to perform an operation in the residual risk calculation.
Previous versions
View also the improvements made to this component in previous versions:
